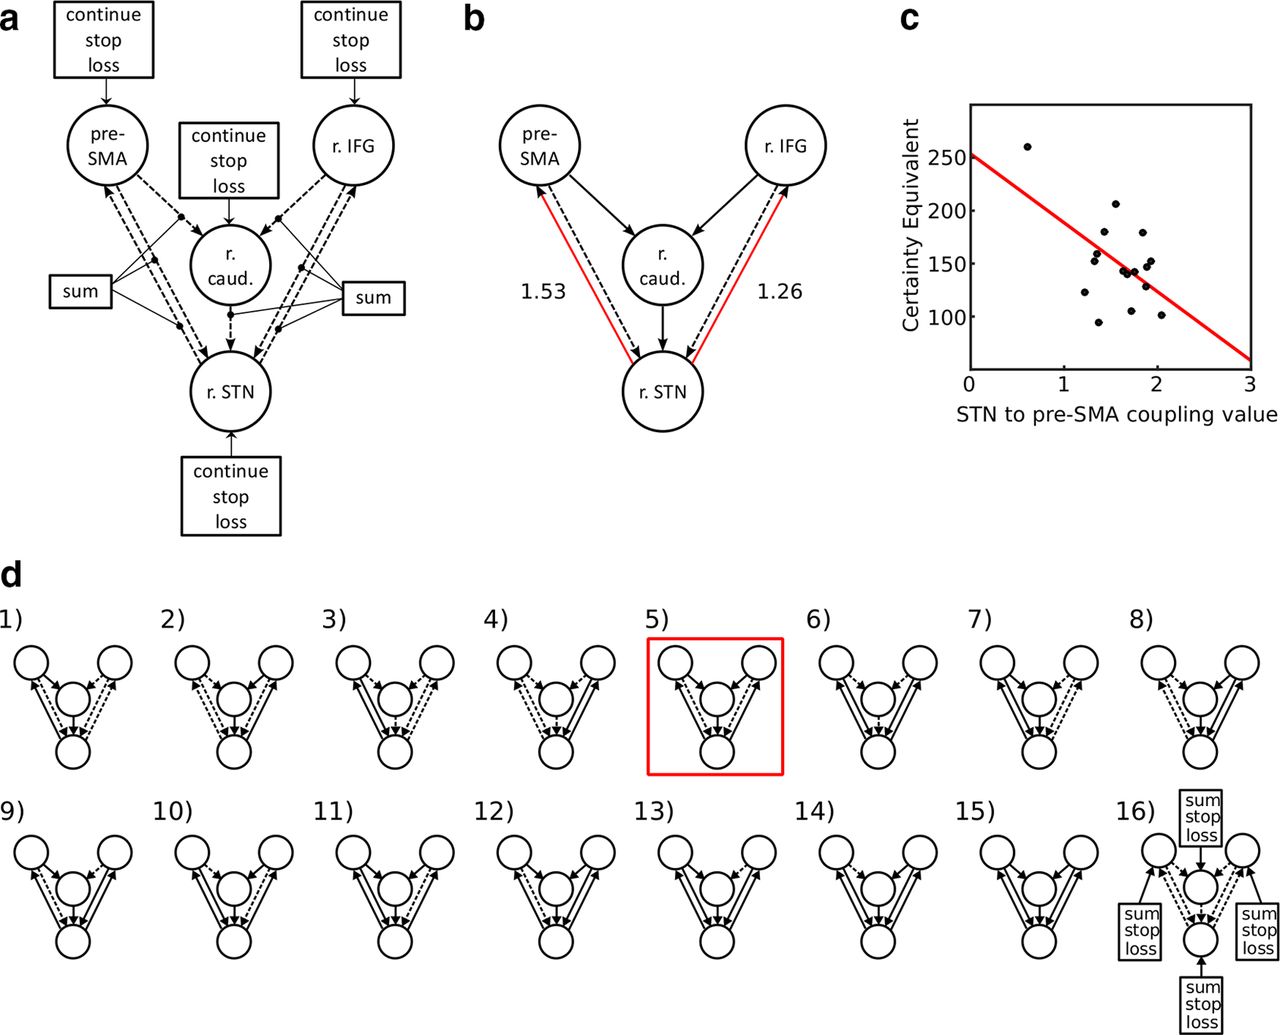
DCM of effective connectivity in the inhibitory control network. a, The modeled network; “continue,” “stop,” and “loss” events perturbed all regions of the network; cumulative gambling modulated the connections between the areas. The model space (d) explored which of the connections were modulated by cumulative gambling. b, The winning model. Solid black and red arrows indicate connections modulated by cumulative gambling. Dashed arrows indicate unmodulated connections. The winning model, as revealed by fixed-effects analysis, shows a modulation of the indirect right IFG–STN and pre-SMA–STN connections by cumulative gambling. Red arrows indicate only the coupling from STN to pre-SMA, and rSTN to right IFG increases significantly with the cumulative gambling regressor at the group level. Numbers next to the red arrows indicate the exponentiated mean coupling scale parameters (p < 0.001 for STN-to-pre-SMA and p = 0.04 for STN-to-IFG, Bonferroni corrected). c, Linear relation between the CE values and exponentiated coupling value from STN to pre-SMA (n = 16). The individual coupling value is predictive of the risk attitude displayed during the task, as reflected by CE. d, Display of the 16 connectivity models tested within the DCM framework. The four circles represent the regions shown in a. Solid arrows indicate connections modulated by cumulative gambling. Dashed arrows indicate unmodulated connections. Red box represents the winning model shown in b. In the null model (model 16), the connections were not modulated by cumulative gambling, and the perturbing input into the network from “continue” was replaced with cumulative gambling.


