Figure 1.
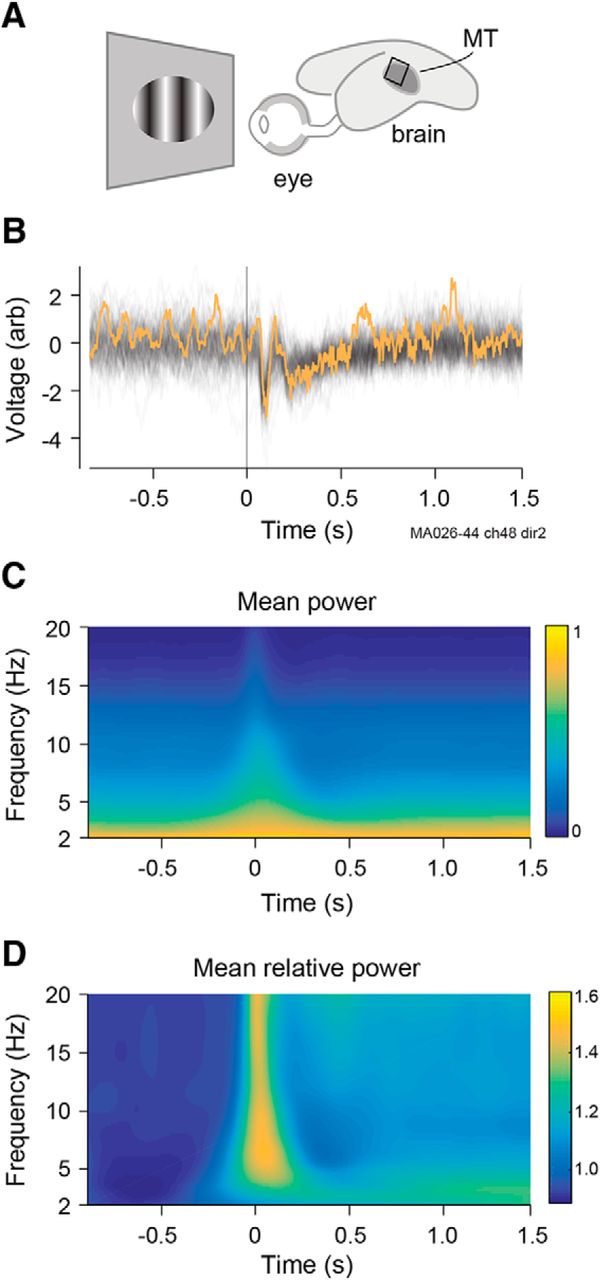
Experimental recordings of LFPs. A, Representation of marmoset eye and brain showing approximate position of MT area and electrode array. B, Raw LFPs at one electrode from contralateral eye for 100 repetitions of the same dot-field stimulus. Stimulus onset is at t = 0 and lasted 2 s. Yellow trace indicates single trial used in Figure 2. C, Power spectrogram of LFP calculated separately for each trial and then averaged across all trials, channels, and recordings. Power was concentrated in delta and low-theta bands. Noncausal signal at low frequencies reflects the filtering. D, Power spectrum as a proportion of prestimulus power in the relevant frequency band.


