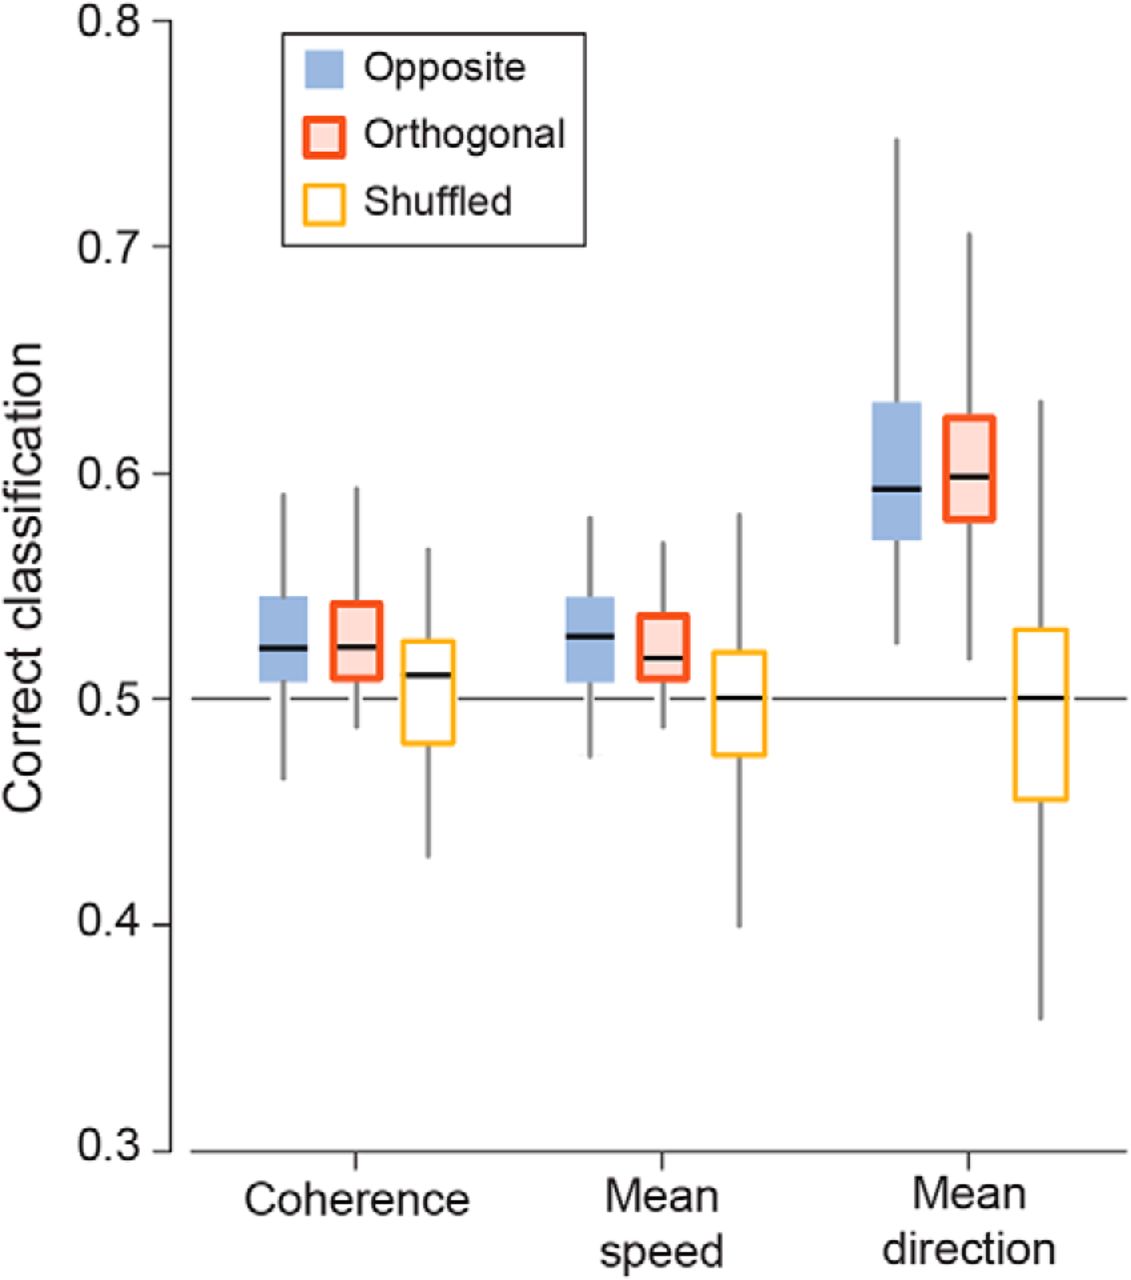
Figure 5.
Unsupervised direction discrimination. Bar-and-whisker plots show SVM classification of stimulus for opposite-direction stimulus pairs (n = 56, 2 stimulus pairs per oscillation frequency for 7 recordings), orthogonal-direction stimulus pairs (n = 112, 4 pairs per frequency), and pairs from shuffled stimulus labels (n = 168) using the following theta-band (5–8 Hz) PVF wave statistics: wave coherence, mean propagation speed, and mean propagation direction. Boxes give 25th, 50th, and 75th percentiles of data; whisker tips give maxima and minima; black horizontal lines show median values. Line at 0.5 indicates chance level.


