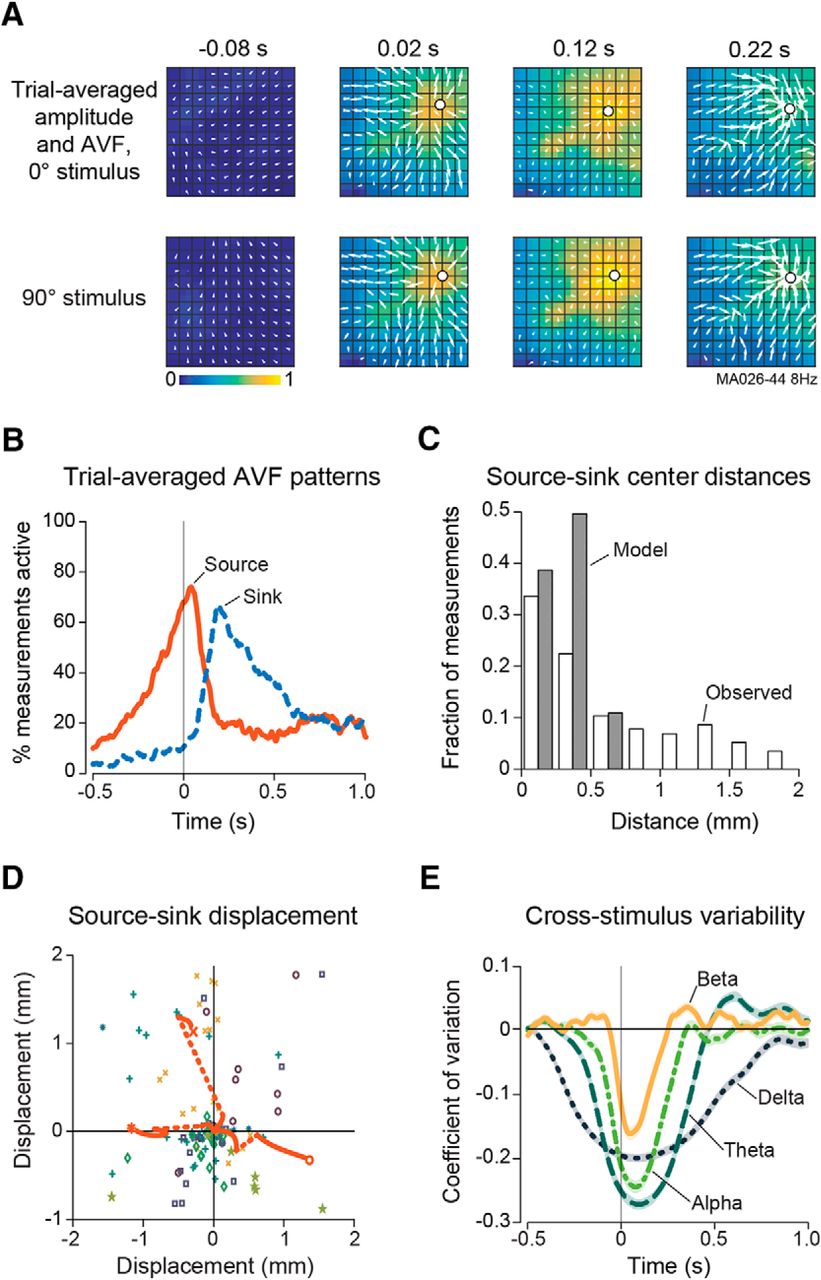
Spatiotemporal activity patterns in trial-averaged signals. A, Trial-averaged amplitude maps and AVFs (white arrows) for different dot-field stimuli in the same recording. Source/sink centers are marked with white dots. B, Percentage of trial-averaged amplitude velocity fields showing widespread source and sink patterns when taken across recordings (n = 7) and center frequencies (n = 19). Prestimulus effects are due to signal filtering. C, Histogram of distance between trial-averaged AVF source and sink pattern centers observed across all recordings and center frequencies compared with model data of a spatially static, noisy structure. D, Relative center location of AVF sink pattern with source pattern center fixed at origin for all frequencies in all recordings. Solid orange lines show the trajectory of source and sink centers for selected points; dashed orange lines show the jump in position from last source pattern to first sink pattern. Symbols and colors correspond to recordings. E, Average channel-by-channel coefficient of variation for trial-averaged amplitude between all stimulus directions by frequency band across all recordings.


