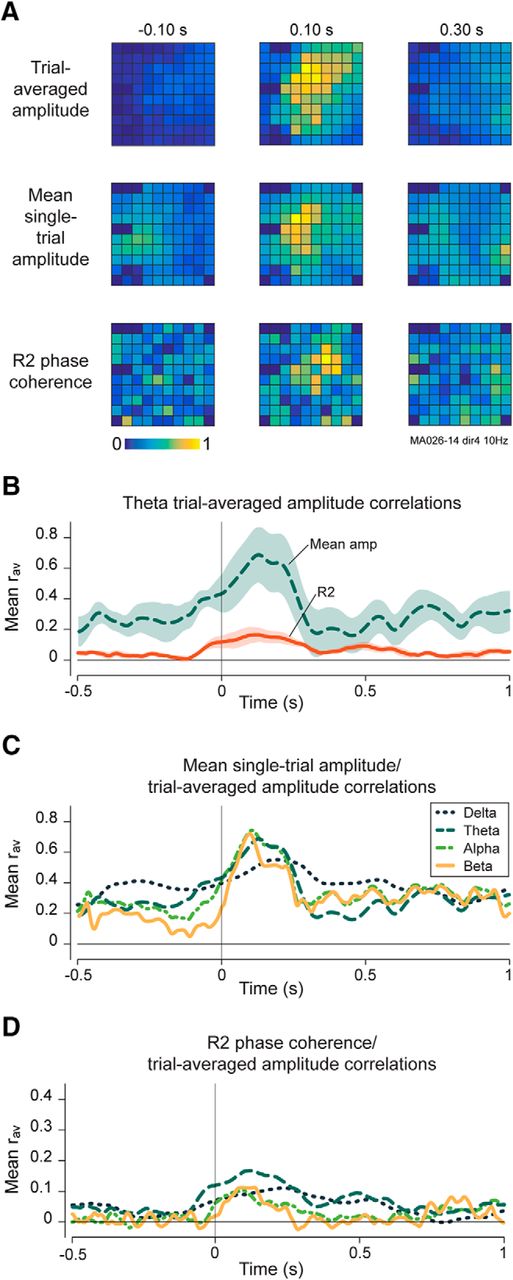
Single-trial mechanisms of trial-averaged amplitude patterns. A, Example of 10 Hz trial-averaged amplitude spatial maps compared with single-trial amplitude and phase coherence maps in one recording. Each row of snapshots is normalized to its maximum value. B, Average spatial correlation coefficients for theta-band oscillations between trial-averaged amplitude and mean single-trial amplitude (Mean amp) maps and between trial-averaged amplitude and R2 phase coherence (R2) maps across all recordings. Shading shows SEM. C, Average spatial correlation coefficients by frequency band between trial-averaged amplitude maps and mean single-trial amplitude maps at the same frequency across all recordings. D, Same as C, but showing correlations between trial-averaged amplitude maps and R2 phase coherence maps.


