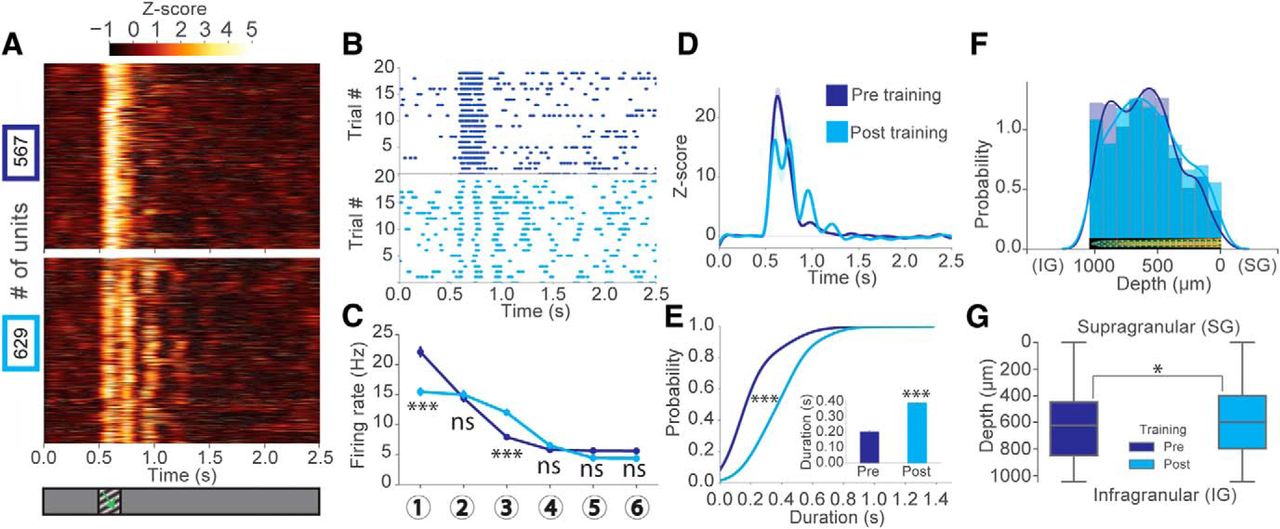
Oscillations emerge with experience to visual stimuli in single-unit activity. A, z score of firing rate for all visually responsive units identified by k-means clustering pretraining (top, blue) versus post-training (bottom, cyan) plotted as a heatmap. B, Top, Representative raster plots across 20 trials pretraining (blue) and post-training (cyan) for individual units from the populations shown in A. C, Average firing rates at 6 oscillation timings pretraining and post-training for all units shown in A. Two-way ANOVA (Factor 1: pre vs post-training; Factor 2: oscillation cycle) significant interaction between training and oscillation cycle on firing rate (F(6,8344) = 33.63, p < 0.001). Tukey HSD multiple comparison of means pre versus post. Selected comparisons: Cycle1: p < 0.001. Cycle2: p > 0.90 (not significant). Cycle3: p < 0.001. Cycle4: p > 0.90 (not significant). Cycle5: p = 0.62 (not significant). Cycle6: p = 0.59 (not significant). N = 567 units pretraining, N = 629 units post-training across 18 mice. D, Population z score (normalized to the baseline period) time course for the units shown in A. E, Cumulative distribution (CDF) of the duration of z score local maxima 1.5 SD above mean for each unit shown in A (two-sample Kolmogorov–Smirnov test pre vs post, D(962) = 0.65, p = 6.99E-92). Inset, Mean peak duration pre versus post (Welch's unequal variances t test, t(962) = 17.79, p = 4.39E-61) (N = 507 units pretraining after peak detection, N = 457 units post-training after peak detection across 18 mice). F, Distribution of all recorded units pretraining (blue) and post-training (cyan) from the probe across the cortical depth from supragranular (SF) to infragranular (IG) layers. G, Boxplots of the cortical depths of all recorded units pretraining versus post-training. There was a mildly significant difference between the distributions of recorded units across the cortical depth before versus after training (two-sample Kolmogorov–Smirnov test pre vs post, D(1899) = 0.06, p = 0.03). Error bars indicate SEM. *p < 0.05, ***p < 0.001.


