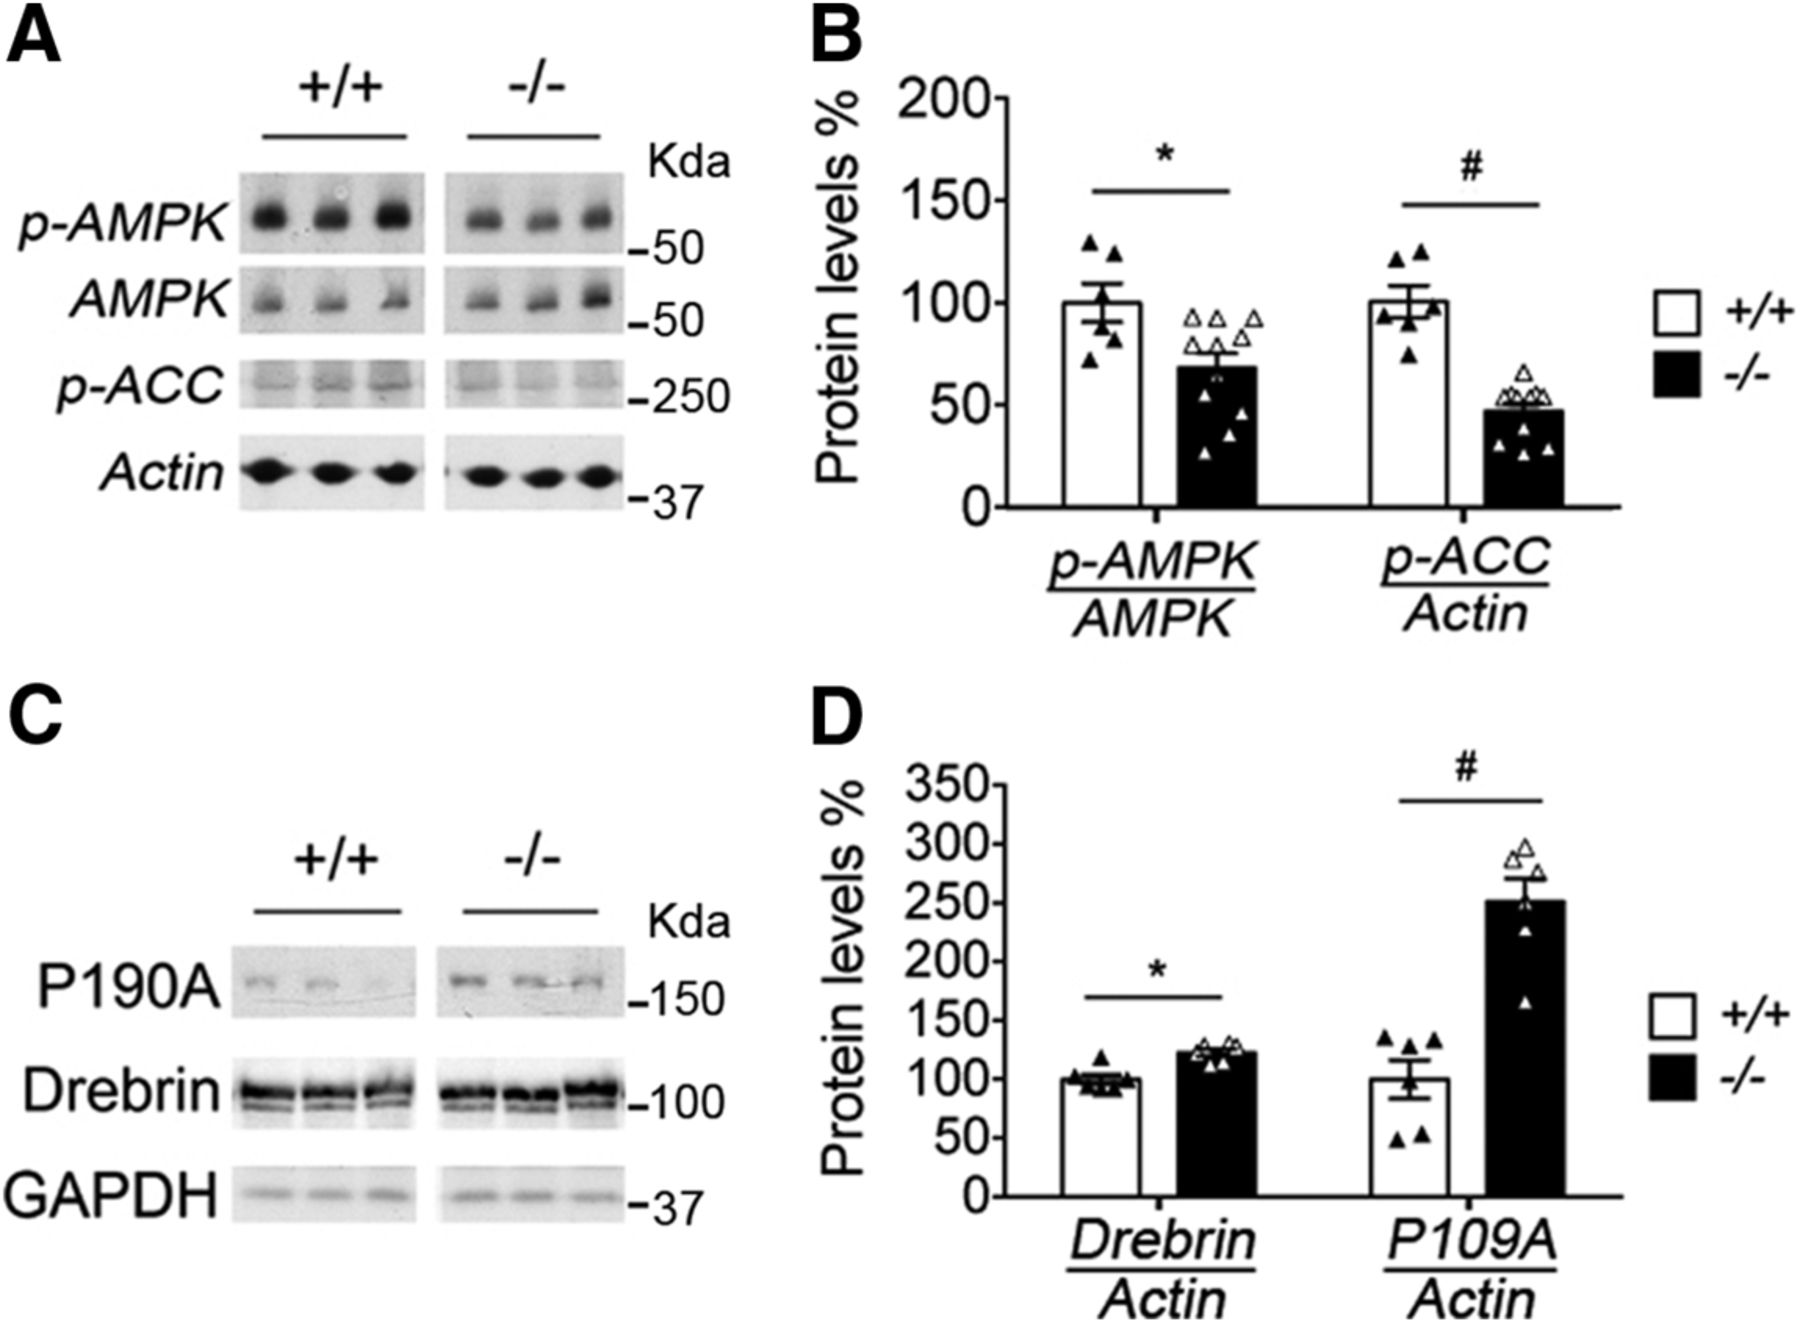
Figure 7.
AMPK signaling and levels of synaptic markers in PFCs of NR4A1 knockouts. A, AMPK signaling in PFCs of NR4A1 KO rats. B, Mean ± SEM of 11 −/− mice compared with 6 +/+ mice. Data expressed as a percentage of controls (unpaired t test comparing genotypes: *p = 0.017 and #p = 0.007). C, Levels of synaptic markers in PFCs of NR4A1 KO rats. D, Mean ± SEM of 6 −/− mice compared with 6 +/+ mice. Data expressed as a percentage of controls (unpaired t test comparing genotypes: *p = 0.0013 and #p = 0.0002). See extended data Figure 7-1.


