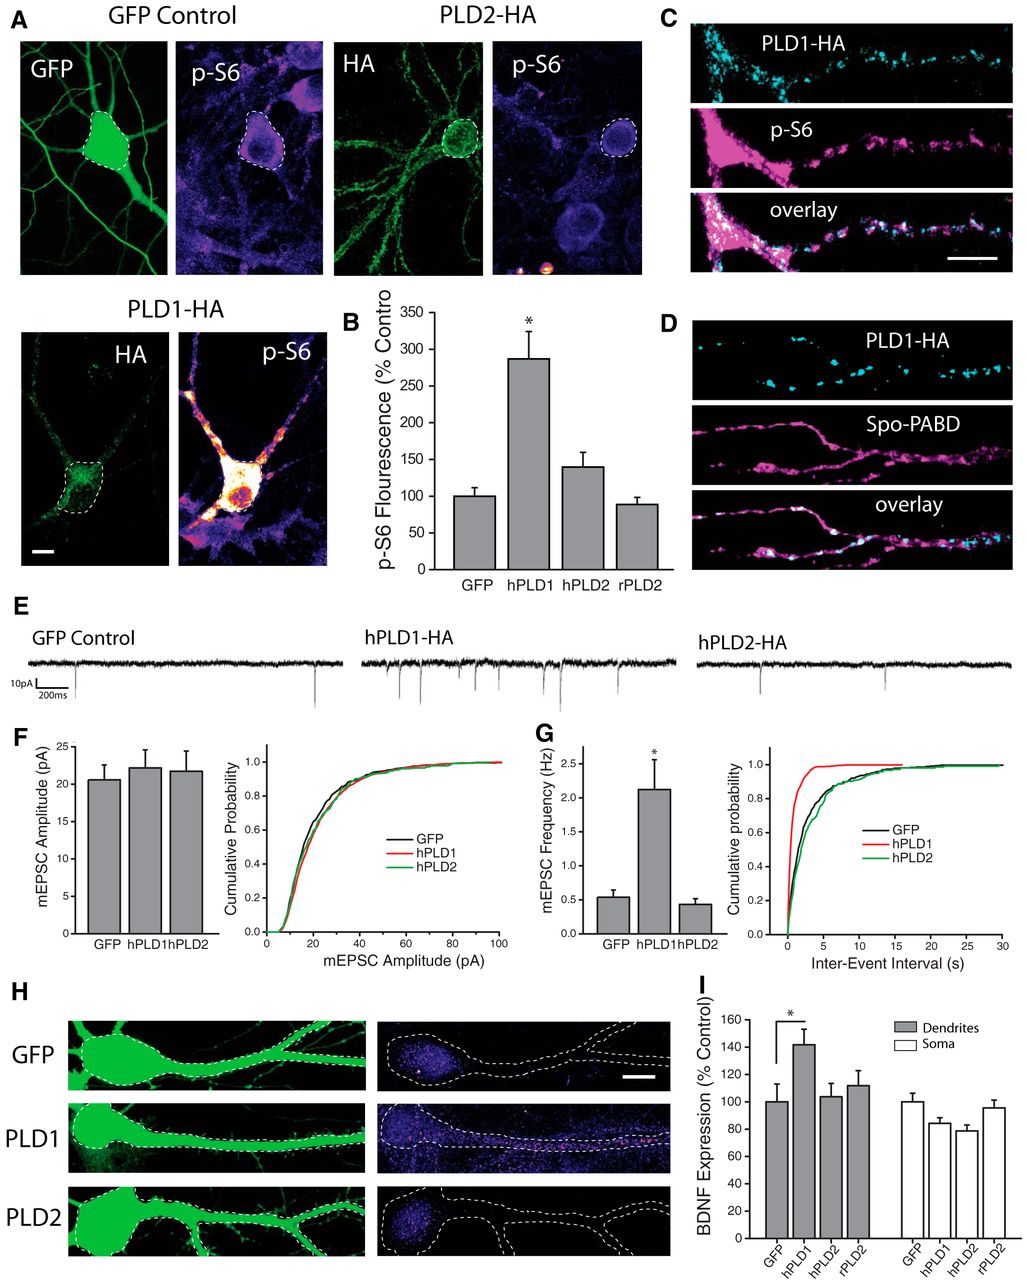
PLD1 overexpression is sufficient to activate mTORC1 and drive changes in synapse function. A, B, Representative images (A) and mean intensity (+SEM,B) of somatic p-S6 staining in neurons expressing HA-tagged hPLD1, hPLD2, or GFP control. GFP control, n = 29 cells; human PLD1-HA, n = 19 cells; human PLD2-HA, n = 26 cells; rat PLD2-HA, n = 25 cells. Expression of hPLD1, but not hPLD2 or rPLD2, significantly (*p < 0.05 relative to GFP-expressing control neurons) increases p-S6 staining. Scale bar represents 20 μm. C, Representative dendritic subregions of cultured hippocampal neurons expressing HA-tagged hPLD1 and stained with an antibody and phosphorylated S6. D, Representative dendritic sections of cells coexpressing HA-tagged hPLD1 as well as the PA reporter Spo-PABD-GFP. Scale bar, 5 μm in C. E–G, Representative recordings (E) and mean (+SEM) mEPSC amplitude (F) and frequency (G) recorded from cells expressing hPLD1, hPLD2 or GFP control. Summary graphs presented on left and cumulative probability distribution shown on right. GFP control, n = 13; hPLD1, n = 11; hPLD2, n = 8. *p < 0.05 relative to vehicle controls. Overexpression of hPLD1, but not hPLD2, is sufficient to elevate mEPSC frequency after 24 Hrs compared with GFP-expressing controls. H, I, GFP and BDNF expression in somatodendritic segments (H), and mean (+SEM) expression (I) of BDNF in somatic and dendritic compartments normalized to average GFP control values, in neurons cotransfected with GFP as well as hPLD1 or hPLD2. GFP control, n = 23 cells; hPLD1, n = 38 cells; hPLD2, n = 26 cells; rPLD2, n = 25 cells. BDNF expression in dendrites was significantly (*p < 0.05, relative to GFP alone) enhanced by expression of hPLD1 compared with control neurons expressing GFP alone, while neurons expressing hPLD2 showed no difference in dendritic BDNF levels compared with control. hPLD1 or hPLD2 overexpression did not increase somatic BDNF intensity compared with controls. Scale bar in H = 10 μm.


