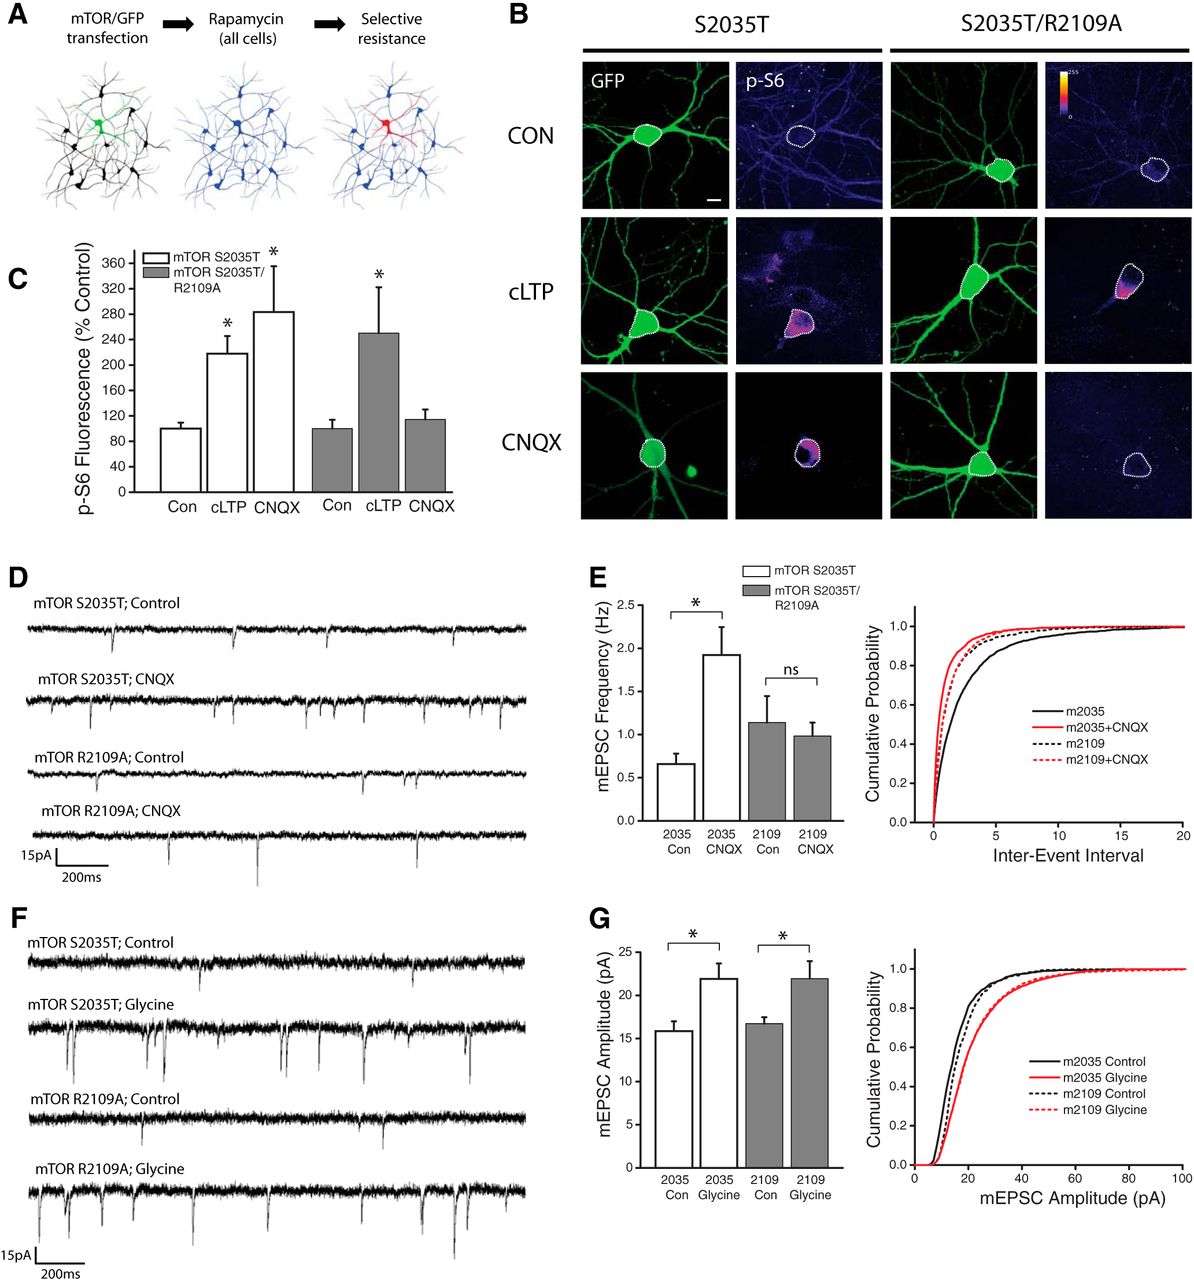
PA binding to mTOR is necessary for enhanced mTORC1 kinase activity during synaptic homeostasis but not cLTP. A, Schematic of experimental design: Neurons were transfected with GFP as well as one of two mutant versions of mTOR (S2035T = Rapamycin resistant; S2035T/R2109A = Rapamycin and PA resistant). Cultures were then treated with rapamycin (100 nm) to eliminate endogenous mTORC1 activity. B, Full frame example images of GFP and p-S6 staining in neurons expressing GFP alongside either mTOR point mutant, under conditions of AMPAR blockade (CNQX, 40 μm, 3Hr), cLTP (Forskolin-based stimulus, 50 μm), or vehicle control. C, Mean (+SEM) somatic intensity of p-S6 staining in groups as indicated. Somatic ps6 in S2035T Control n = 37 cells; S2035T cLTP, n = 22 cells; S2035T CNQX, n = 15 cells; S2035T/R2109A Control, n = 26 cells; S2035T/R2109A cLTP, n = 22 cells; S2035T/R2109A CNQX, n = 16 cells. Inhibition of PA/mTOR interaction (via R2109A mutation) eliminates increased mTORC1 kinase activity in the context of AMPAR blockade, but not during cLTP. Scale bar, 10 μm in B. p < 0.05 compared with vehicle controls in each group. D, E, Representative recordings (D) and mean (+SEM) mEPSC frequency (E) recorded from cells expressing GFP as well as Rap-resistant (mTOR S2035T) or PA-resistant (mTOR R2109A) mTOR point mutants under treatment conditions as indicated. Summary graphs presented on left and cumulative probability distribution shown on right. (*p < 0.05 relative to vehicle controls). S2035T Control, n = 26; S2035 CNQX, n = 14; S2035T/R2109A Control, n = 9; S2035T/R2109A CNQX, n = 16. Inhibition of PA/mTOR interaction (via R2109A mutation) eliminates the mTORC1-dependent increase in mEPSC frequency after AMPAR blockade. F, G, Representative recordings (F) and mean (+SEM) mEPSC amplitude (G) recorded from cells expressing GFP as well as Rap-resistant (mTOR S2035T) or PA-resistant (mTOR R2109A) mTOR point mutants under treatment conditions as indicated. Summary graphs presented on left and cumulative probability distribution shown on right. S2035T Control, n = 12; S2035T cLTP, n = 9; S2035T/R2109A Control, n = 10; S2035T/R2109A cLTP, n = 8. (*p < 0.05 relative to vehicle controls). Inhibition of PA/mTOR interaction (via R2109A mutation) has no effect on the mTORC1-dependent increase in mEPSC amplitude after cLTP induction.


