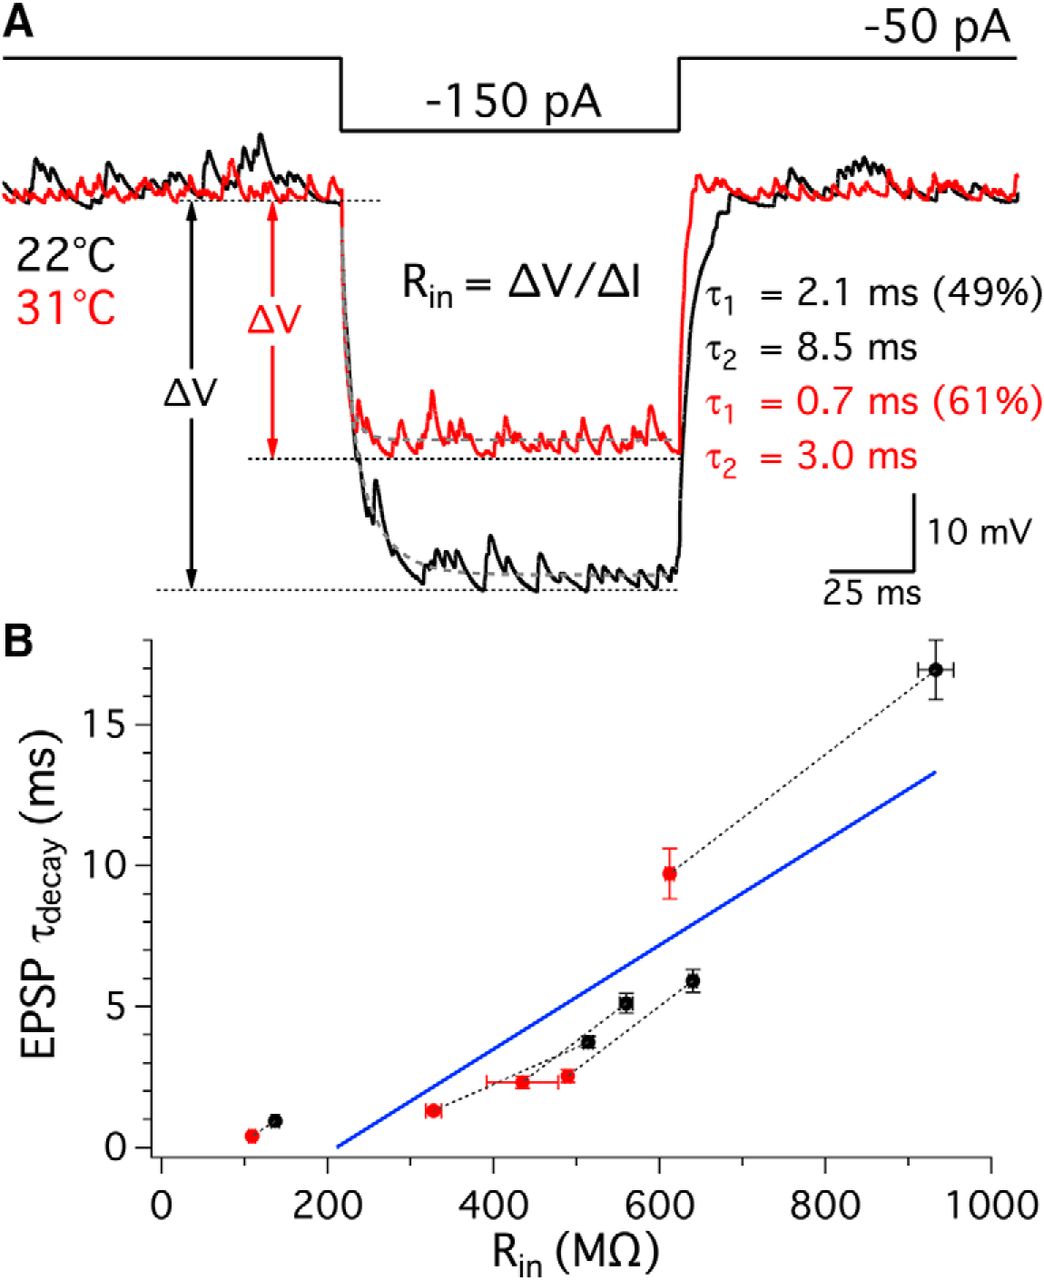
Afferent fiber membrane input resistance and EPSP decay kinetics. A, In current clamp, afferent fibers were hyperpolarized by injection of negative currents from −50 to −150 pA for 100 ms. Averages of membrane potential responses from one afferent fiber at 22°C and 31°C are shown in black and red, respectively. Red and black arrows indicate the absolute change in membrane potentials at 22°C and 31°C, respectively. Input resistance of an afferent fiber was calculated following Ohm's law, Rin = ΔV/ΔI. The decay phase of the membrane potential was fit by a double exponential function (gray dashed lines). B, τdecay of EPSPs was plotted against Rin of the respective fibers. Each pair of data points recorded from the same afferent fiber is connected with a dashed line: room (black) and high (red) temperature (n = 5). A linear regression fit is shown in blue and indicates a positive correlation between EPSP τdecay and Rin (slope = 0.018 ± 0.003, R2 = 0.79, p = 0.0006).


