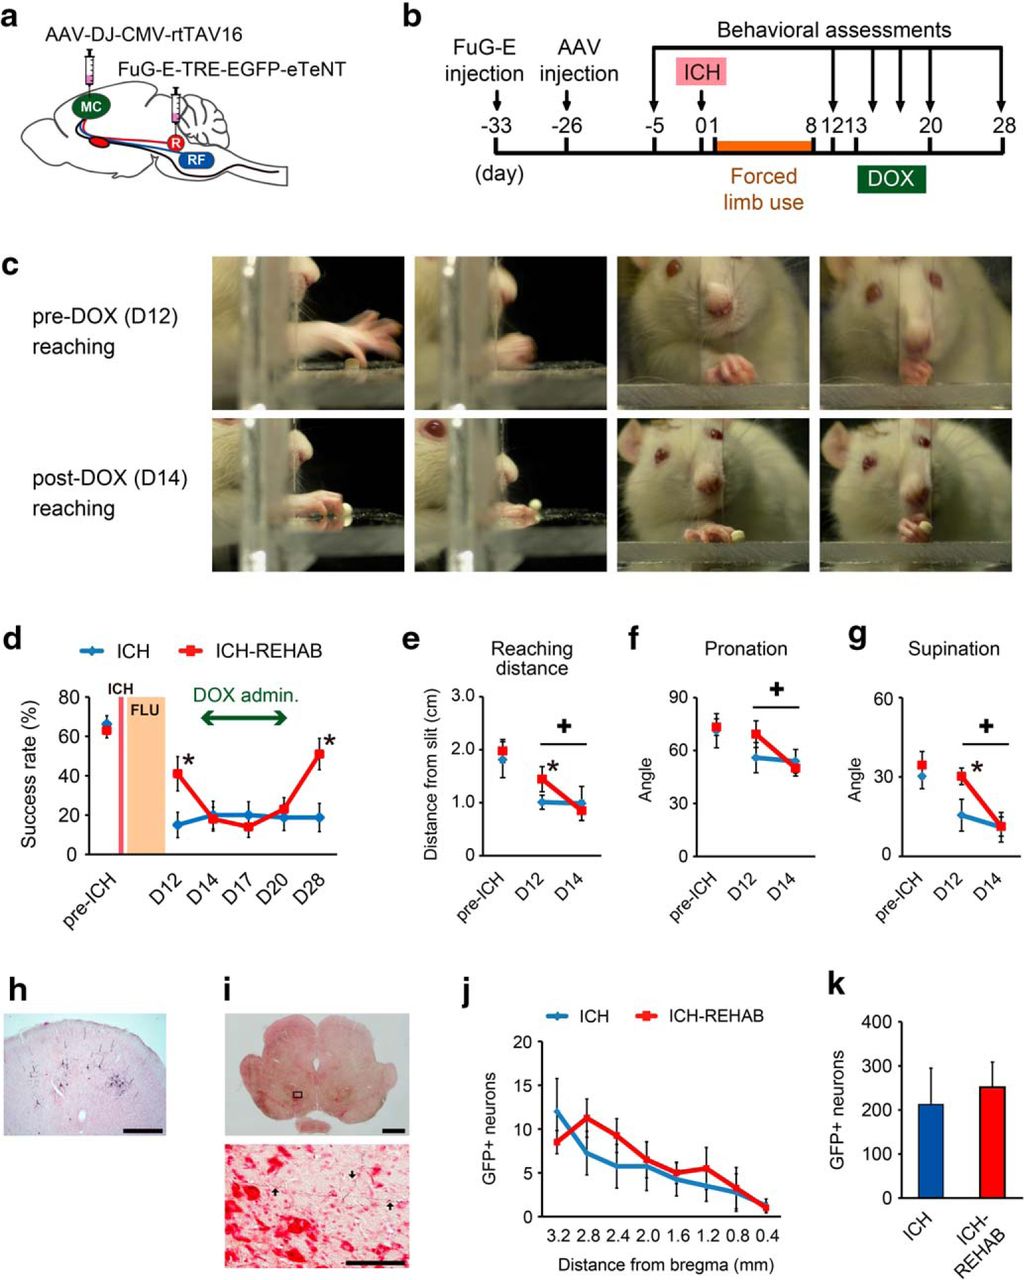
Effects of selective blockade of the cortico-rubral pathway on reaching function in the early-recovery phase. a, Schematic diagram of the experimental arrangement. Animals were injected with AAV-DJ-CMV-rtTAV16 into the forelimb area of the ipsilesional motor cortex (MC) and with FuG-E-TRE-EGFP-eTeNT into the ipsilateral red nucleus (R) to block the cortico-rubral tract. b, Time course of the experiment. Both FuG-E and AAV vectors were injected before ICH surgery. Behavioral assessments were performed 5 d before ICH and 12, 14, 17, 20, and 28 d after ICH. DOX was administered on days 13–20. c, Representative images of the reaching movements of an ICH-REHAB rat before and after DOX administration. DOX-treated rats showed difficulties in extension of their forelimb and rotation of the wrist during grasping. d, Average reaching success rates for the ICH (n = 4) and ICH-REHAB (n = 5) groups. The ICH-REHAB group showed significantly better performance than the ICH group after forced limb use (FLU) at day 12. The recovered performance dropped to the control level during DOX administration. e–g, Frame-by-frame analyses of the quality of reaching movements. e, Averaged distance of reaching from the front wall of the test apparatus. f, g, Averaged range of wrist pronation (f) and supination (g) during grasping and followed by withdrawal of the limb. h, i, Anti-GFP immunohistochemistry showing GFP-positive pyramidal cell bodies in the ipsilesional motor cortex (h) and GFP-positive axons in the ipsilesional red nucleus (i). i, Bottom, Higher-magnification view of the top. Arrows indicate GFP-labeled fibers. j, Rostrocaudal distribution of GFP-labeled neurons in ICH (n = 4) and ICH-REHAB (n = 4) groups. GFP-positive cells were predominantly present in the rostral forelimb area. k, Averaged number of total GFP-positive neurons in both groups. *p < 0.05 versus ICH. +p < 0.05. Data are mean ± SEM. Scale bars: i, Top, 1000 μm; h, 500 μm; i, Bottom, 100 μm.


