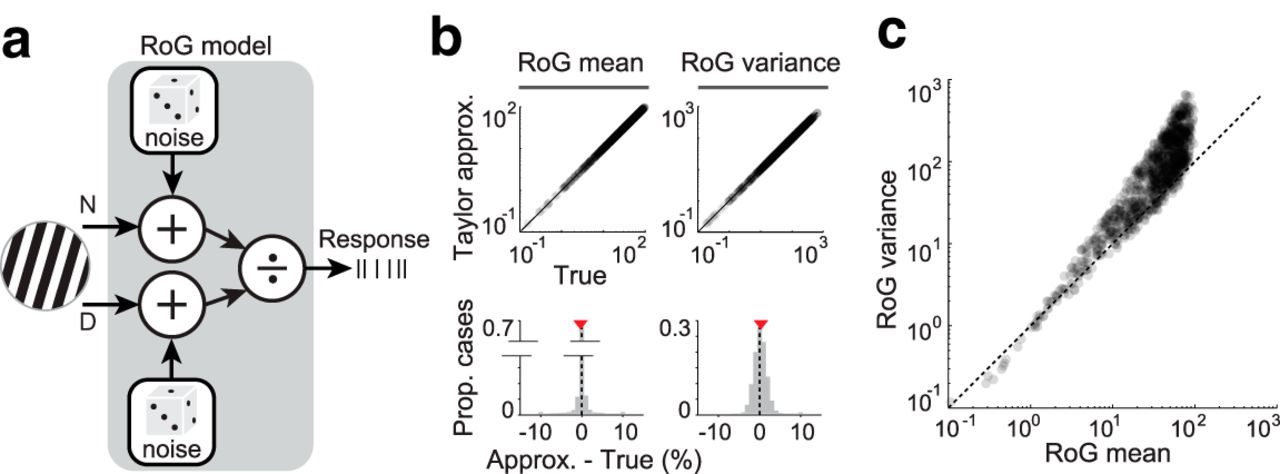
RoG model. a, The RoG model describes neuronal responses as the ratio of two stimulus-driven signals: the numerator N and denominator, or normalization signal, D. Both N and D are corrupted by additive Gaussian noise with Poisson-like variability (Eq. 1.9). b, Comparison of the approximation we derived for the RoG mean and variance (Eq. 1.4) and the true value (estimated from 1 million simulated trials), across 1000 experiments. Each experiment uses a different set of model parameters (i.e., corresponding to different neurons and stimuli), and each trial is a random draw from the corresponding distribution. Red triangles represent average percentage difference between true and approximated mean (left) or variance (right). c, RoG variance versus mean across 1000 simulated experiments. Model parameters for the simulations in b and c are drawn uniformly in the following intervals: μN ∈ [0,100]; μD ∈ [0.5, 1.5]; αN = 1; αD = 0.01; βN = βD ∈ [1,1.5]; ρ ∈ [0,0.5]; μη = 0; ση2 = 0.1μN/μD.


