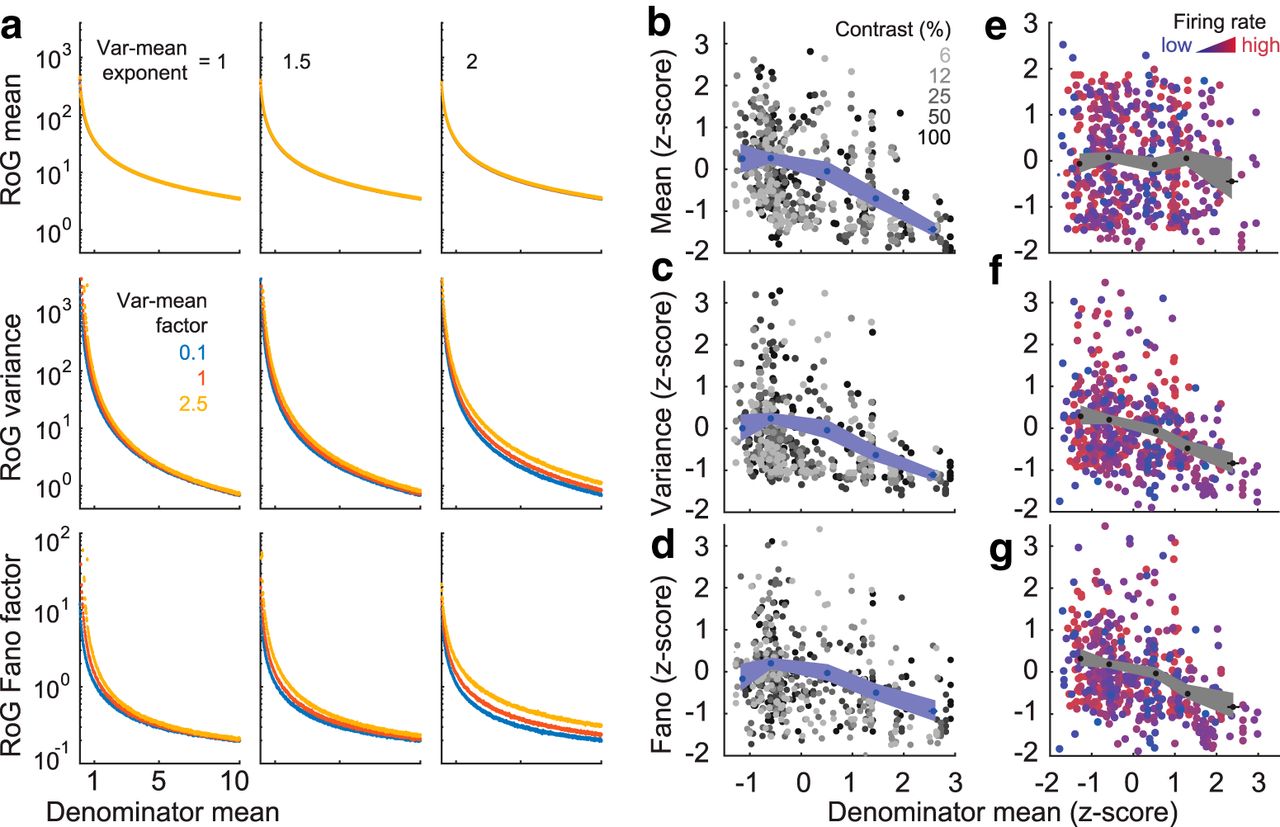
Normalization reduces response variability. a, Relation between the normalization strength (abscissa) and mean (ordinate, top), variance (middle), or Fano factor (bottom) in the RoG model. Columns represent different values of the exponent of the relation between mean and variance of the denominator. Different colors represent different values of the proportionality factor between mean and variance of the denominator. Other parameters are set to μN = 35; μD ∈ [0.1,10]; αN = 1; βN = 1; ρ = 0; μη = 0; ση2 = 0.1μN/μD. b–d, Relation between the z-scored normalization strength and the z-scored response mean (b), variance (c), or Fano factor (d) in the data. z scoring was performed across all neurons, but separately within each contrast condition. Gray symbols represent individual neurons and contrasts. Blue symbols represent average across neurons and contrasts. Shaded areas represent 95% CI. e–g, Similar to b–d, but with z scoring performed across all neurons and contrast levels with similar firing rate. Firing rate bins were logarithmically spaced between the minimum and maximum firing rates measured. Black symbols represent average across neurons and contrasts. Shaded areas represent 95% CI


