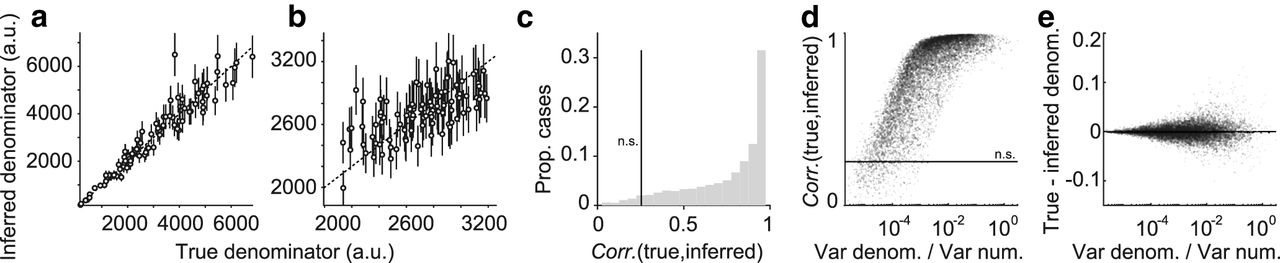
Inference of single-trial normalization strength in the RoG model. a, b, Comparison of the true and inferred single-trial normalization strength, across 100 trials of two simulated experiments. Error bars: standard deviation of the inferred values. c, Histogram of Spearman correlation coefficients between true and inferred values, across 10,000 simulated experiments each with 100 trials. The model was formulated as in Methods eq. (1.16) for the contrast response function, with parameters drawn from the uniform distribution in the following intervals: Rmax ∈ [10,100]; ϵ ∈ [15,25]; βN = βD ∈ [1.5,2]; ρ = 0; μη = 0; ση2 = 0, with contrast between 20 and 50%, and with αN, αD set to enforce a Fano factor of 1 at a 75% contrast. d, Correlation between true and inferred values (ordinate) as a function of the ratio between the variances of the denominator and numerator in the RoG model (abscissa). Correlation coefficients smaller than the vertical line (c) or horizontal line (d) are not statistically significant (p > 0.05). e, Difference between true and inferred values of the denominator, expressed as a fraction of the true value.


