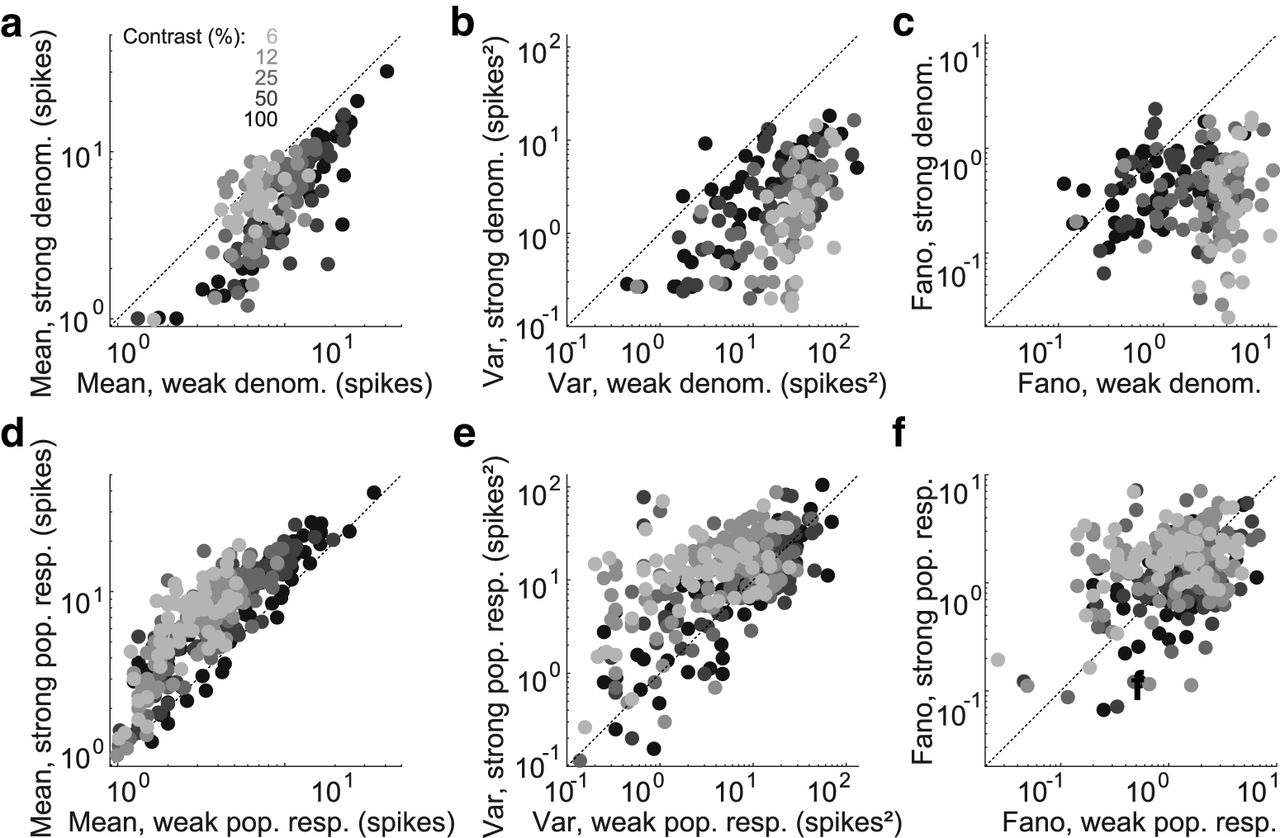
Reduced response variability during epochs with strong normalization. a, Each symbol denotes, for one neuron and one contrast condition, the mean spike count across trials with inferred strong (ordinate) versus trials with inferred weak (abscissa) normalization signal. Only neurons with large across-trials variance of the normalization signal (at least 1% of the variance of the numerator) and trials with at least one spike are included. b, C, Same as a, but for response variance (b) and Fano factor (c). d, e, f, Same as a, b, c, but using as a proxy of single-trial normalization strength the total activity of a population of simultaneously recorded neurons.


