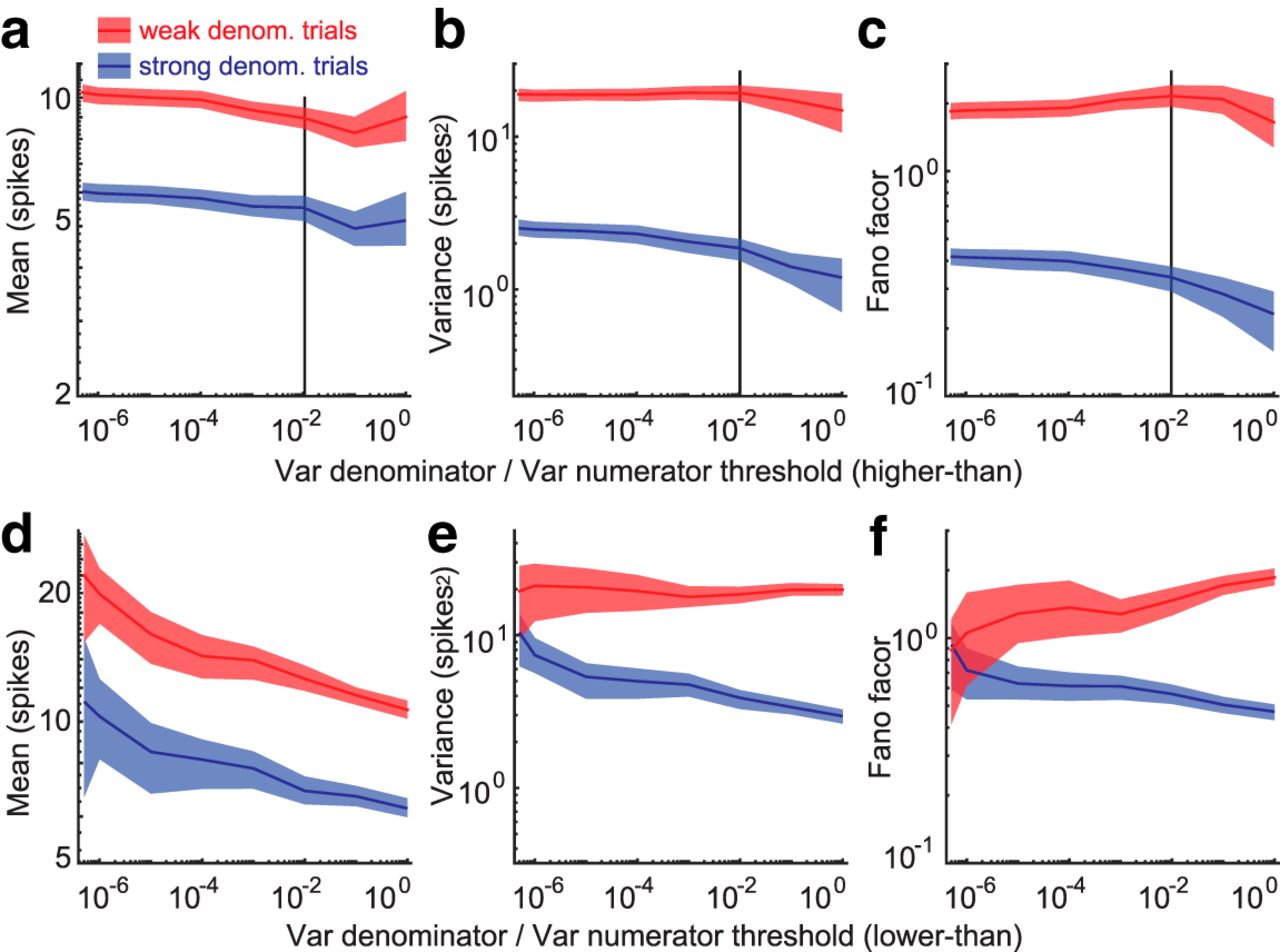
Reduced variability during epochs with strong inferred normalization is robust to choice of threshold. a, Average spike count (ordinate) across neurons and contrast conditions for which the ratio between denominator variance and numerator variance was larger than the threshold (abscissa). Averages are computed over the subset of trials with strong (blue) or weak (red) inferred normalization signal. Shaded areas: 95% CI Black vertical line: the threshold used for Fig. 5. b, c, Same as (a) but for the spike count variance (b) and Fano factor (c). d–f, Same as a–c, but including neurons and contrast conditions for which the ratio between denominator variance and numerator variance was smaller than the threshold (abscissa). The largest threshold in d–f and the smallest threshold in a–c correspond to including all neurons and contrast conditions.


