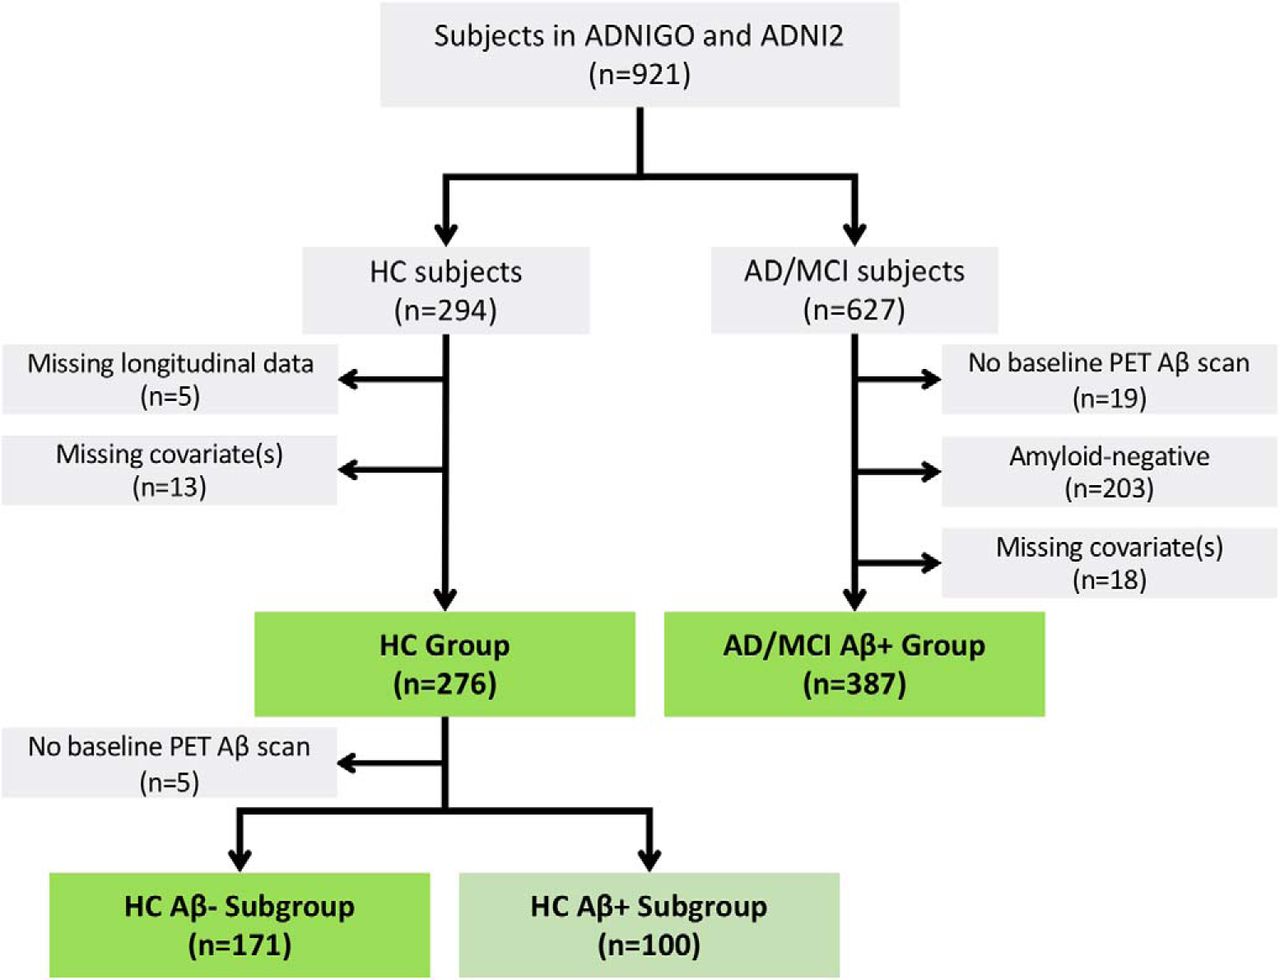
Figure 1.
Flow diagram of determination of included subjects in HC and AD/MCI study groups. All AD/MCI were PET-confirmed Aβ+ (above the amyloid positivity cutoff); HC were separated into Aβ+ and Aβ− subgroups for further analyses. Groups and subgroups investigated in green.


