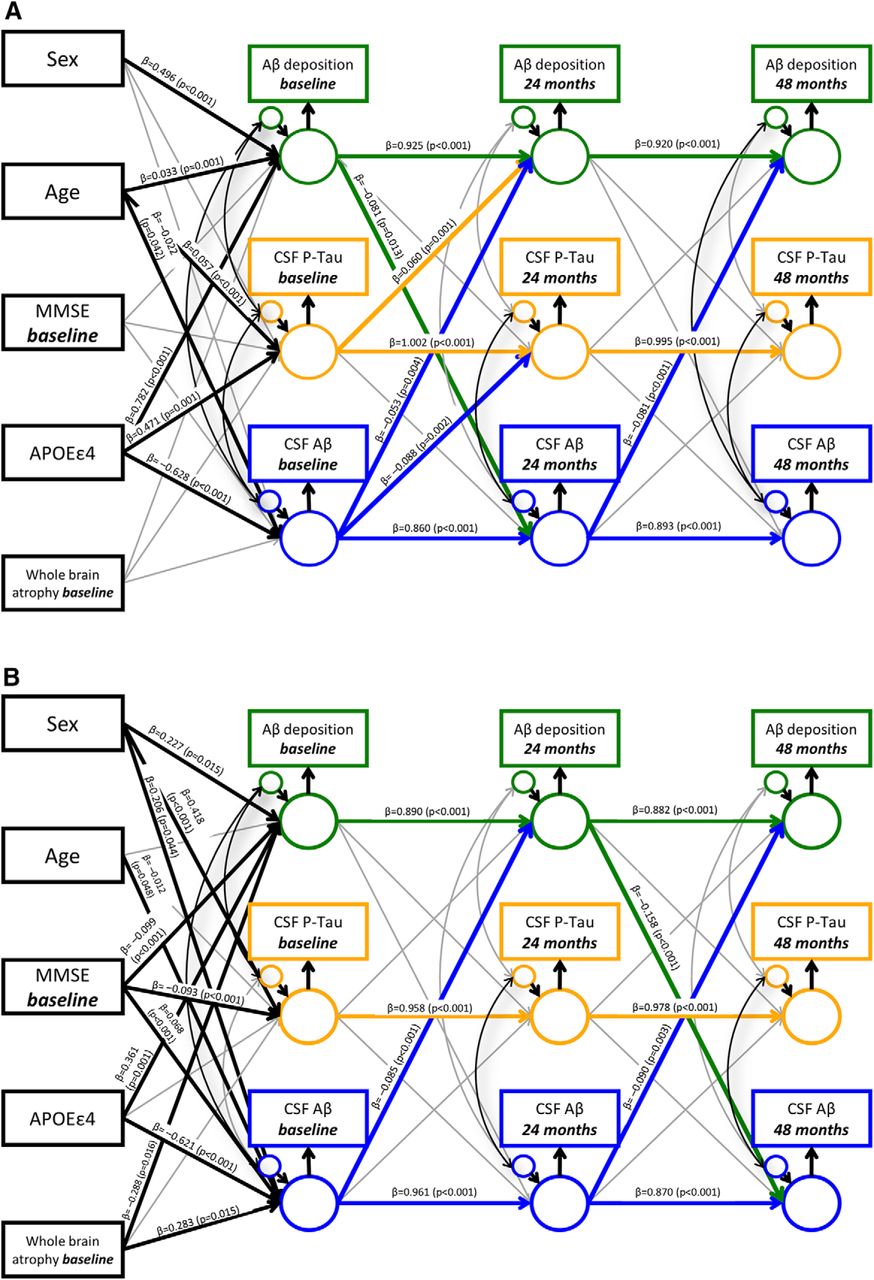
Cross-lagged panel model results in (A) HC and (B) AD/MCI subjects. PET-derived Aβ burden, CSF p-tau concentrations, and CSF Aβ42 concentrations are modeled across three waves (baseline, 24 months, and 48 months) with covariates sex, baseline age, baseline MMSE score, APOEε4, and baseline whole-brain atrophy. Rectangles, Observed variables; large circles, grand mean centered variables; small circles, residual variances; thin gray arrows, nonsignificant longitudinal predictions or correlations between residuals; black arrows, significant covariate associations or correlations between residuals; green arrows, significant longitudinal predictions from Aβ deposition to a variable at a subsequent time point; orange arrows, significant longitudinal predictions from CSF p-tau concentrations to a variable at a subsequent time point; blue arrows, significant longitudinal predictions from CSF Aβ concentrations to a variable at a subsequent time point. Standardized coefficients (β) and p values are displayed for all significant predictions. The complete covariance and correlation matrices are provided for HC in Figure 2-1 and Figure 2-2, and for AD/MCI in Figure 2-3 and Figure 2-4.


