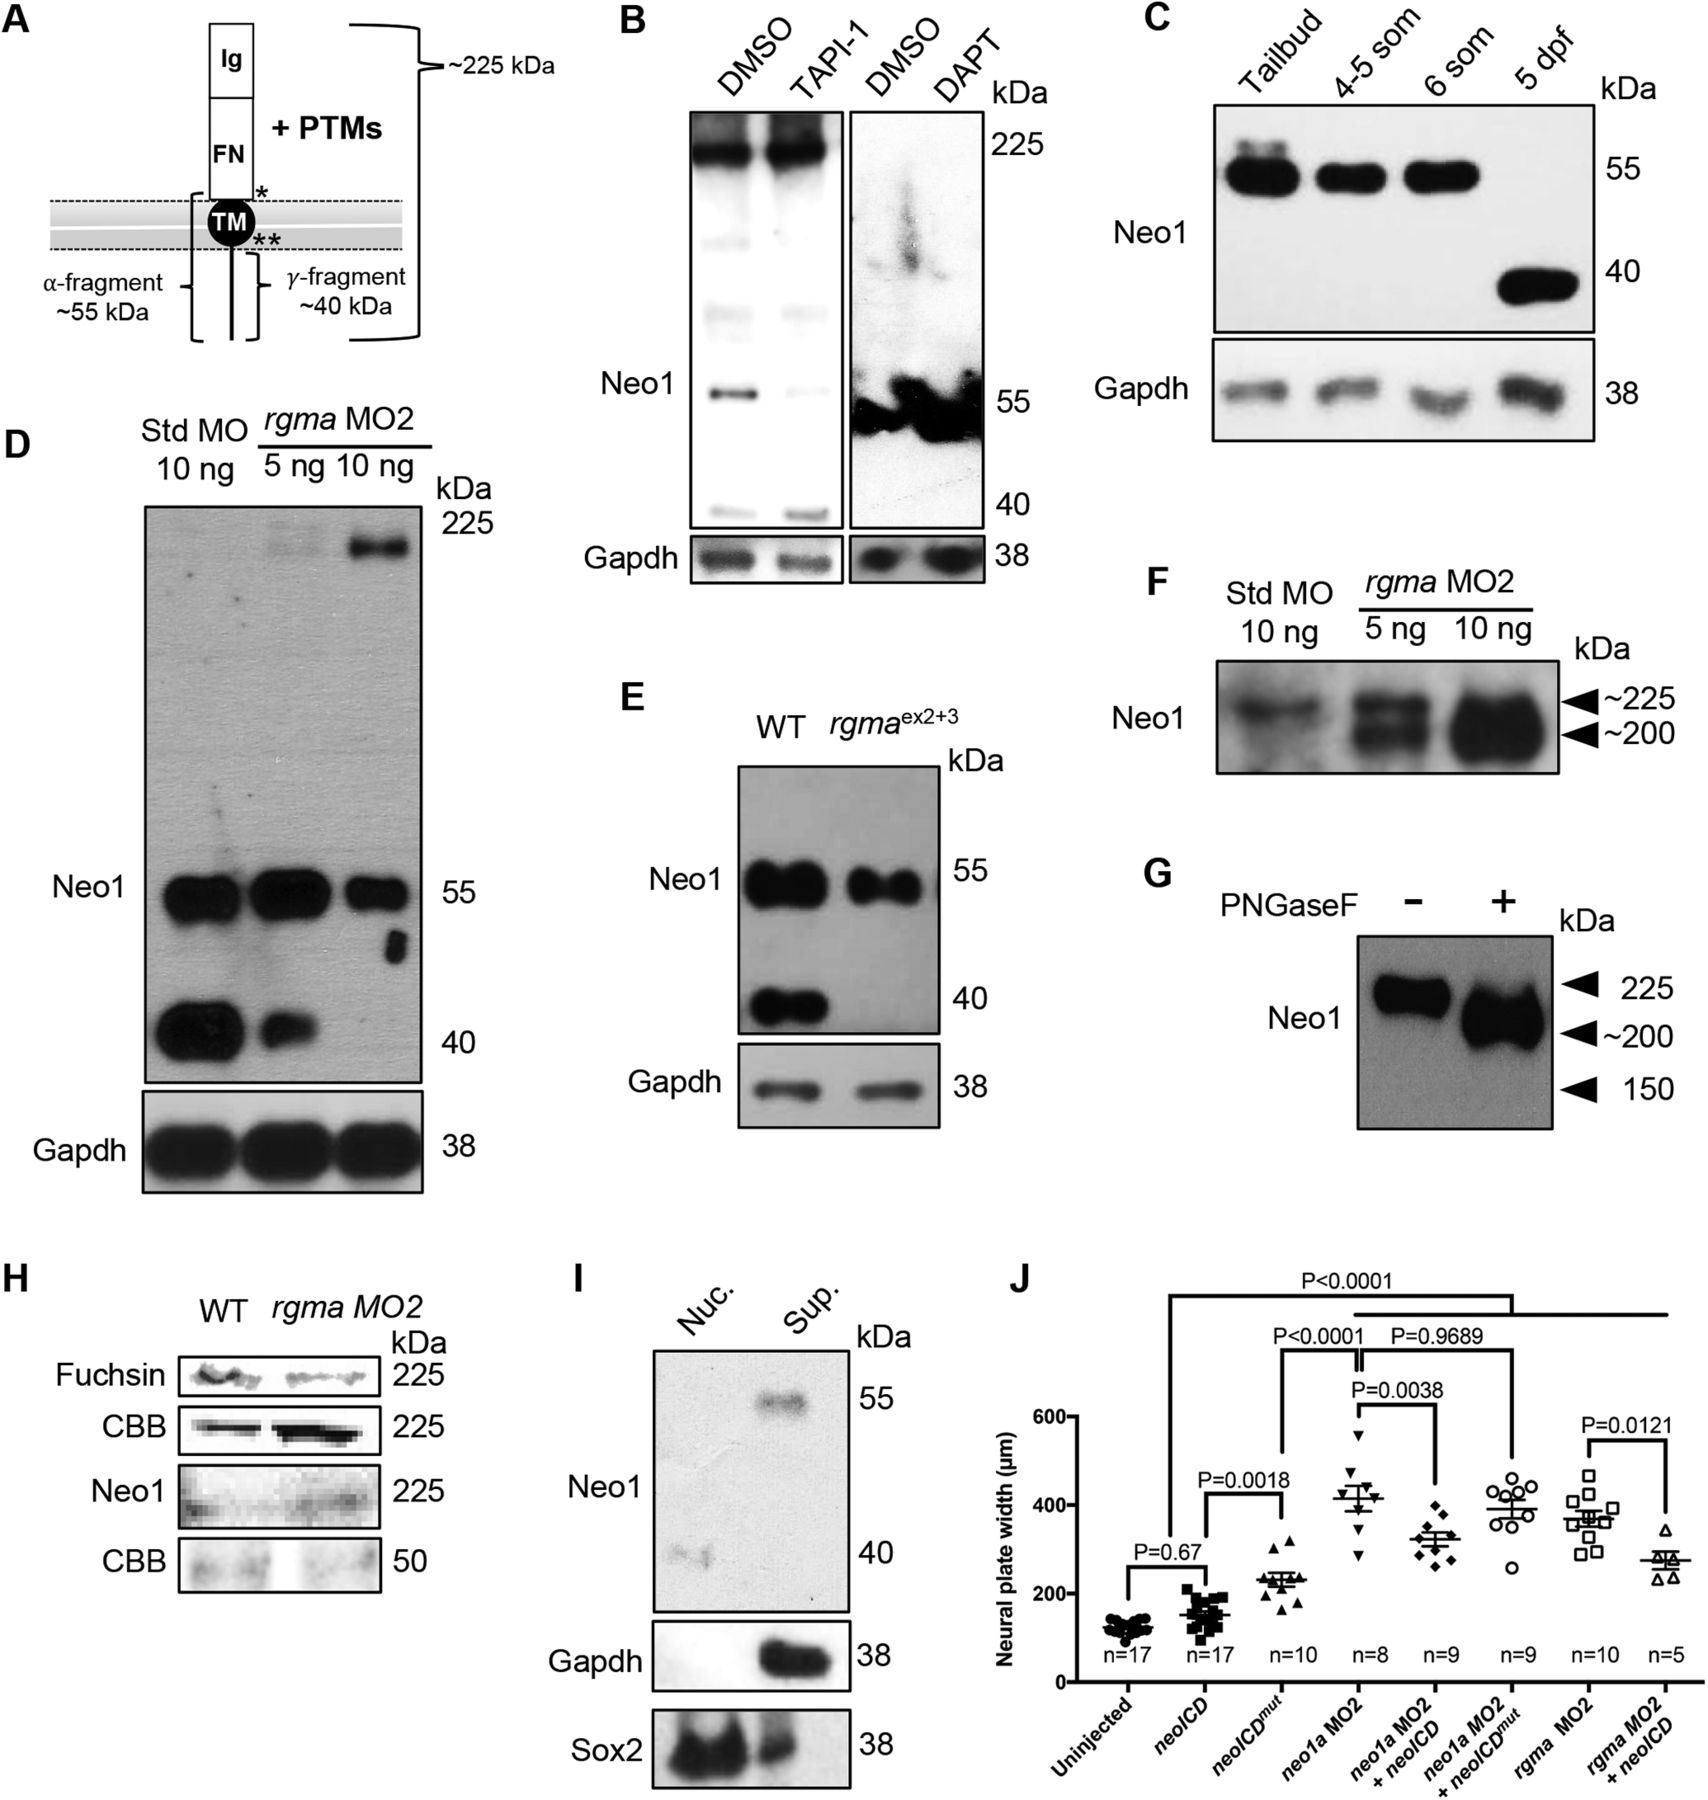
Rgma promotes intramembrane proteolysis of Neo1. A, Diagram of Neo1 embedded in the plasma membrane. Ig, 4 immunoglobulin domains; FN, 6 fibronectin Type III domains; TM, transmembrane domain. *α-Secretase/ADAM17 cleavage site. **γ-Secretase cleavage site. B, Western blot analysis of Neo1 (Neo1a and Neo1b) protein from embryos treated with DMSO vehicle, 100 μm of the α-secretase/ADAM17 inhibitor TAPI-1, 8 ng/μl of the γ-secretase inhibitor DAPT in the presence (first two lanes) or absence (last two lanes) of the proteasome and nuclear export inhibitors MG132 and LMB, respectively. C, Western blot analysis of low-molecular weight Neo1 products (55 and 40 kDa) produced at the tailbud, 4–5 som, 6 som, and 5 dpf stages. Gapdh is shown as a loading control. D, Western blot analysis of endogenous Neo1 levels in protein extract from 24 hpf embryos injected at the 1 cell stage with std MO (10 ng per embryo, left lane) or rgma MO2 (5 and 10 ng per embryo, middle and right lanes, respectively). E, Western blot analysis of endogenous Neo1 levels in protein extract from 32 hpf uninjected embryos (left lane) or embryos injected at the 1 cell stage with rgma gRNA exon 2 + 3 and HF-nCas9 (rgmaex2+3; right lane). F, Overnight exposure of the Western blot shown in D revealing the 225 kDa band (top arrowhead) and a second lower molecular weight band (lower arrowhead, ∼200 kDa) in rgma MO2 lanes (center and right lanes) but only faintly in the control std MO-injected lane (left lane). The signal intensity of both bands is increased in the rgma MO2 lanes. G, Western blot analysis of Neo1 in the absence (left lane) and presence (right lane) of PNGaseF. H, Oxidized glycans, total protein, and Neo1 in rgma MO2-injected embryos relative to std MO-injected controls detected using in-gel periodic acid Schiff assay, Coomassie staining (CBB), and Western blotting, respectively (see Materials and Methods). I, A fractionated lysate was analyzed by immunoblot using Neo1 antibodies. The purified nuclear fraction (Nuc.) and supernatant (Sup.) are shown in left and right lanes, respectively. J, Width of the NP measured at 4–5 som in embryos that were uninjected (123.5 ± 3.60 μm, n = 17), injected at the 1 cell stage with 50 pg of neoICD mRNA (151.8 ± 7.89, n = 17), 50 pg of neoICDmut (231.40 ± 15.58 μm, n = 10), 5 ng neo1a MO2 (414.7 ± 28.81 μm, n = 8), 5 ng neo1a MO2 + 50 pg of neoICD mRNA (322.6 ± 15.68 μm, n = 9), 5 ng neo1a MO2 + 50 pg of neoICDmut (390.90 ± 21.07 μm, n = 9), 5 ng of rgma MO2 (368.90 ± 17.83 μm, n = 10), and 5 ng rgma MO2 + 50 pg of neoICD mRNA (274.60 ± 20.08 μm, n = 5). Data are mean ± SEM. Statistical significance was determined using Tukey's test.


