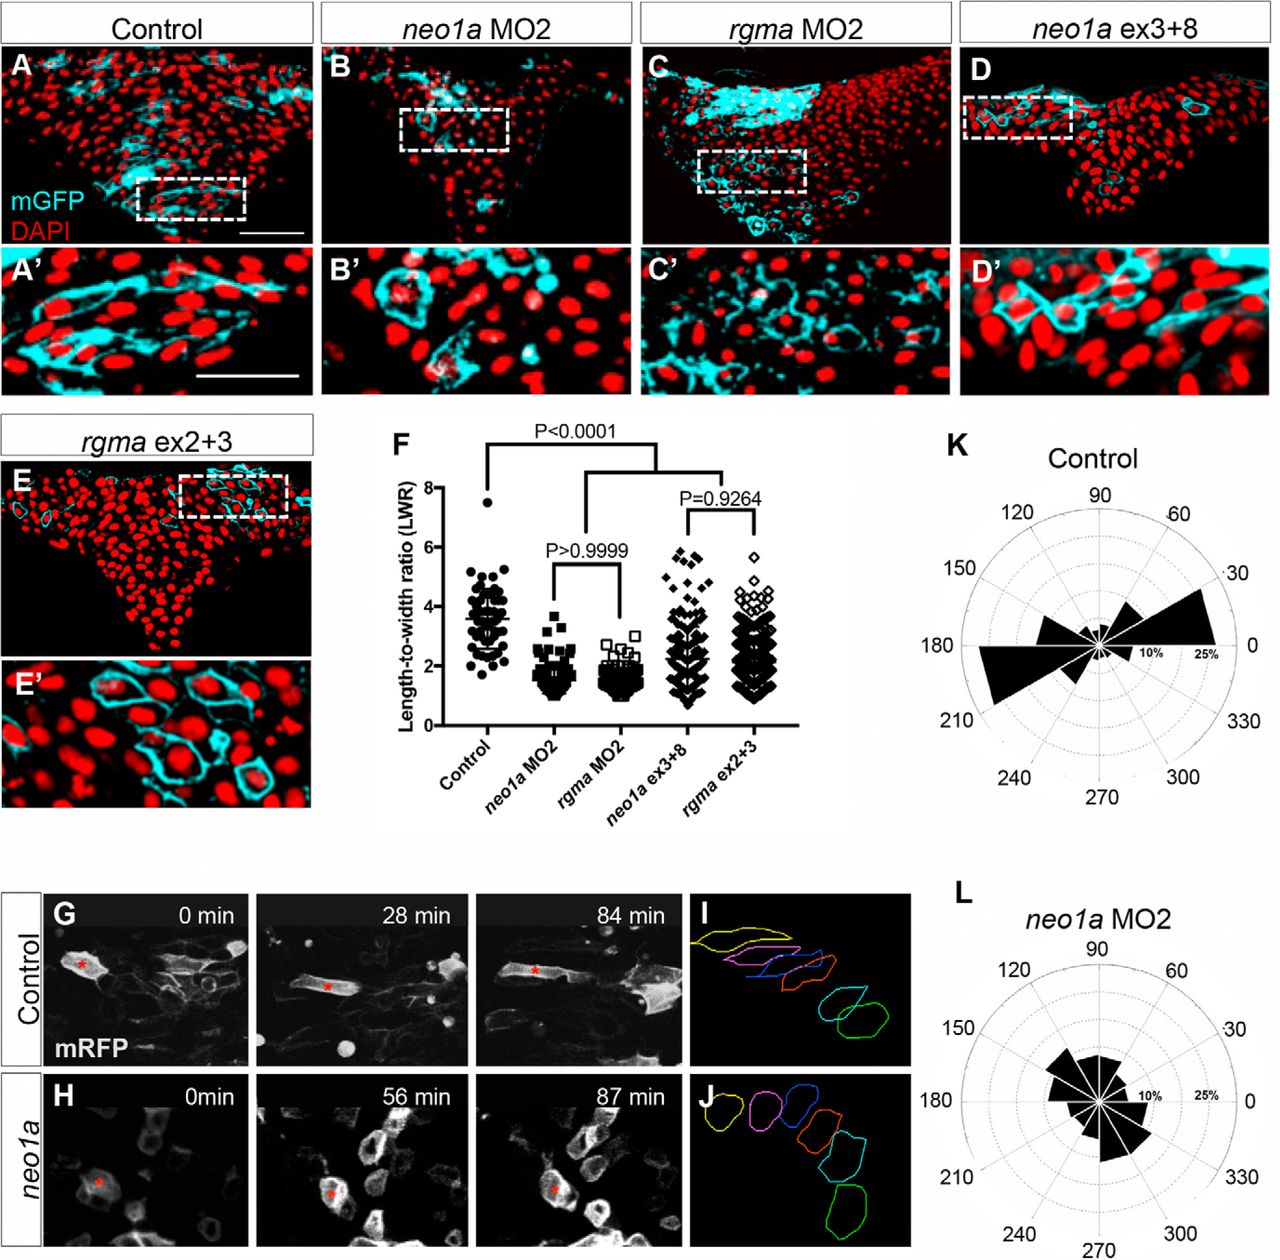
Rgma and Neo1a are required for NEC elongation during infolding. A–E, Mosaic mGFP signal (cyan) was detected by immunofluorescence using anti-GFP antibodies along with DAPI counterstain of nuclei (red) on hindbrain transverse sections of 4–5 som embryos that were uninjected (A), injected with neo1a MO2 (B), rgma MO2 (C), neo1a/b gRNA exon 3 + 8 and HF-nCas9 (D), or rgma gRNA exon 2 + 3 and HF-nCas9 (E). Scale bar, 50 μm. A′–E′, Insets, Higher magnification of NEC morphology within the selected regions in A–E. Scale bar, 50 μm. F, Quantification of LWRs of labeled NECs in 5–10 embryos from each group treated as in A–E. G, H, Selected frames from time-lapse imaging of live NECs in control (top) and neo1a MO2-injected (bottom) embryos mosaically labeled with mRFP DNA and imaged in the hindbrain region from a dorsal view, beginning at ∼1–2 som and extending through 5–6 som. I, J, Representative traces of individual labeled cells from control (G) and neo1a MO-injected (H) embryos as in G and H. Colored traces represent changes in shape and position of individual NECs over time. Green trace represents time 0. Yellow trace represents last time point. Red dotted line indicates midline. K, L, The 30° radial grid (rose plot) showing the average cell shape change over time of control, uninjected, and Neo1a-depleted NECs, where 0° and 180° are medial and lateral extremes along the mediolateral axis of the neural keel, respectively.


