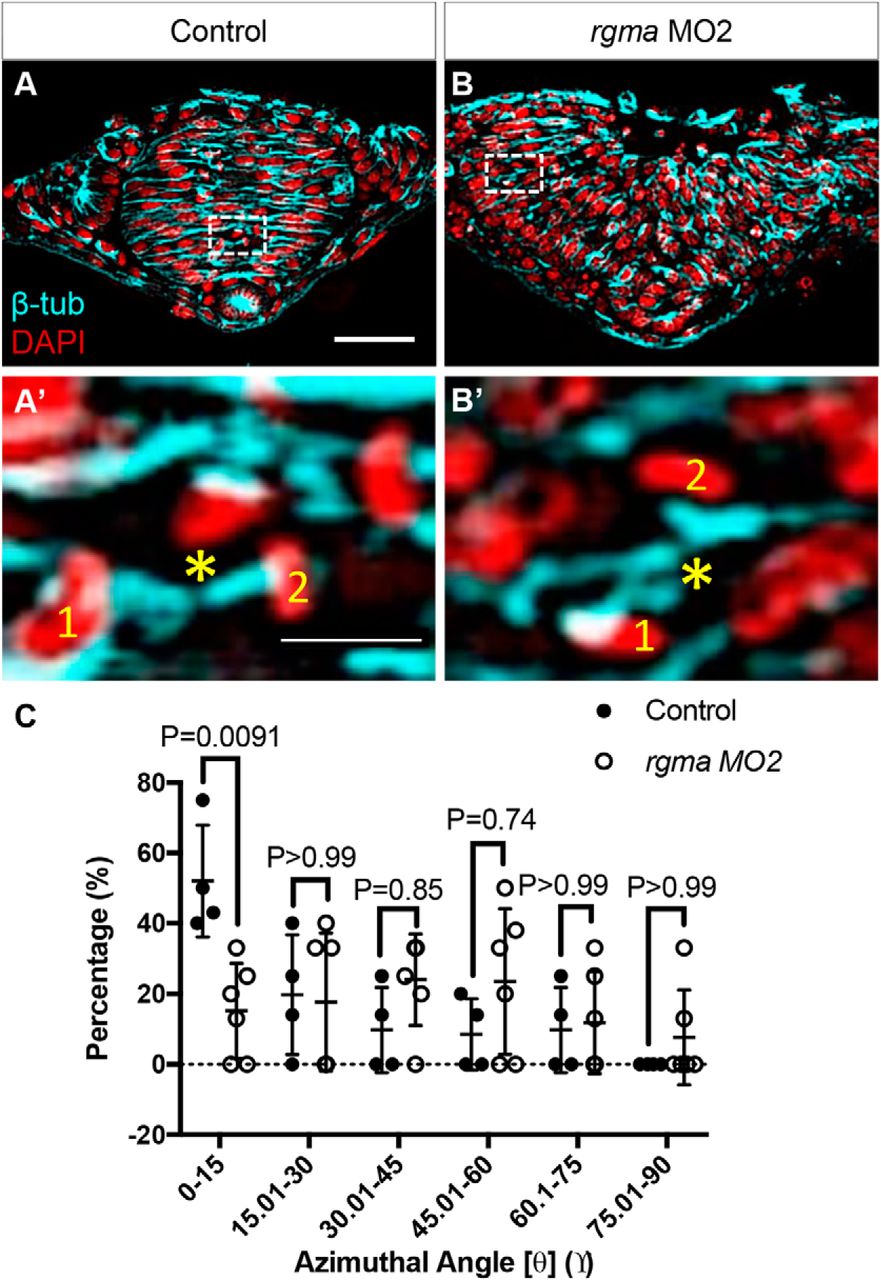
Figure 7.
Rgma depletion disrupts C divisions. A, B, Transverse sections through the hindbrain of 8–10 som control (uninjected, A) and rgma MO2-injected (B) embryos immunolabeled with anti-tubulin (MTs, cyan) and counterstained with DAPI (nuclei, red). Scale bar, 50 μm. A′–B′, Insets, Higher magnification of the boxed regions in A and B showing daughter cells (1 and 2) with the estimated position of the midbody (*). Scale bar, 10 μm. C, Percentage of cell divisions occurring at each azimuthal angle (θ). Control, n = 20 cell divisions from 4 embryos; rgma MO2, n = 26 cell divisions from 6 embryos.


