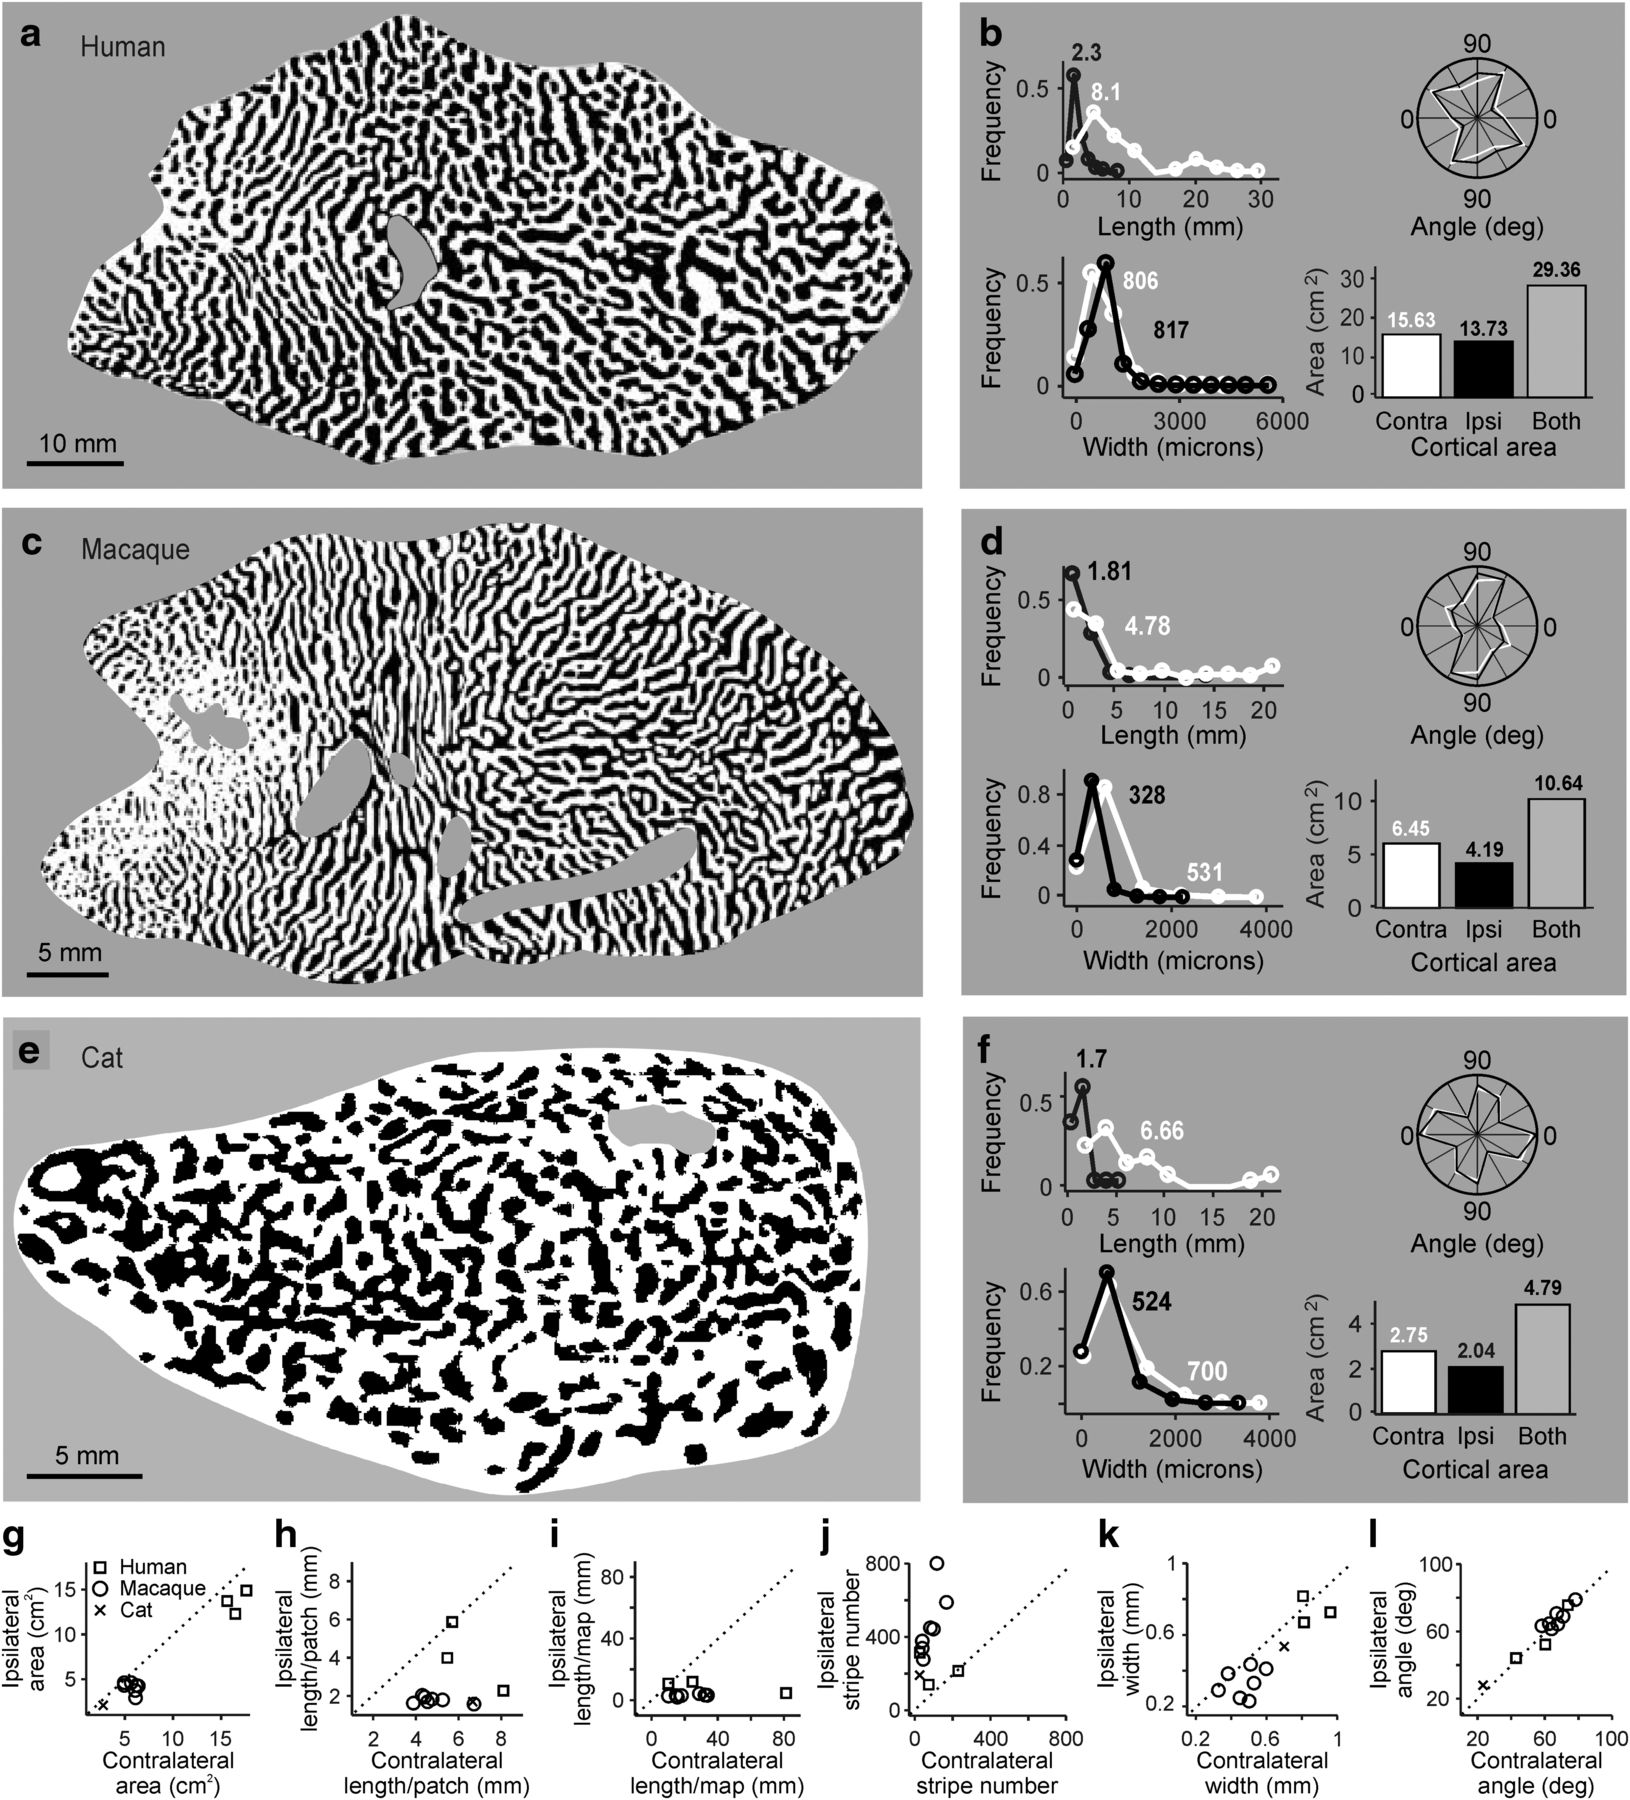
Quantification of ocular dominance patterns in human, macaque, and cat cortex. a, Human ocular dominance map shown in a binary image. Reproduced with permission from Adams et al. (2007). Unless specified differently, all ocular dominance maps and plots within the paper show the contralateral eye in white and ipsilateral eye in black. b, Histograms illustrating distributions of length, angle, width, and total area of white and black image features. Contralateral-eye stripes (white) tend to be longer than ipsilateral-eye stripes (black). c, Same as in a, but for a male macaque. Reproduced with permission from Adams et al. (2007). d, Same as in b, but for a male macaque. e, Same as in a, but for a cat. Reproduced with permission from Kaschube et al. (2003). f, Same as in b, but for a cat. g–l, Comparison of ocular dominance stripes from contralateral- (x axis) and ipsilateral-eye stripes (y axis), shown for human (n = 3), macaque (n = 7; 4 males and 3 females), and cat cortical hemispheres (n = 1).


