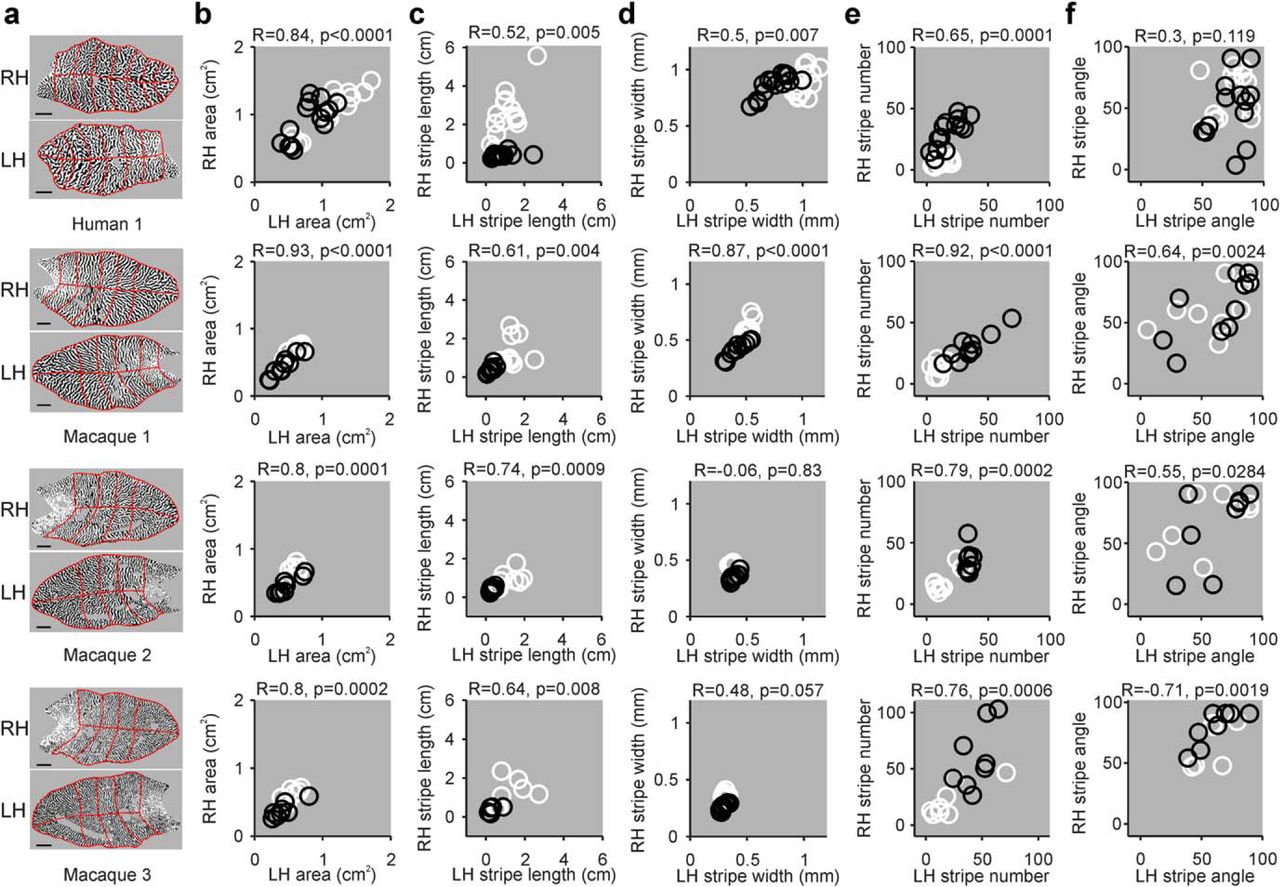
Correlation between ocular dominance patterns from left and right V1 hemispheres. a, Maps of ocular dominance from the right hemisphere (RH) and left hemisphere (LH) obtained from the scientific literature for a human (Human 1; reproduced with permission from Adams et al., 2007) and 3 macaques (male macaques: 1–2, female macaques: 3, reproduced with permission from Horton and Hocking, 1996). Red lines indicate the retinotopic sectors from human and macaque retinotopic maps used to calculate the different ocular dominance parameters. Scale bars: human, 10 mm; macaque, 5 mm. b, Correlations between LH and RH area for human 1 (top) and macaques 1–3 (bottom). Each circle represents a measurement from a different retinotopic sector for the contralateral eye (white) and ipsilateral eye (black). c–f, Same as in b, but for stripe length (c), stripe width (d), stripe number (e), and stripe angle (f).


