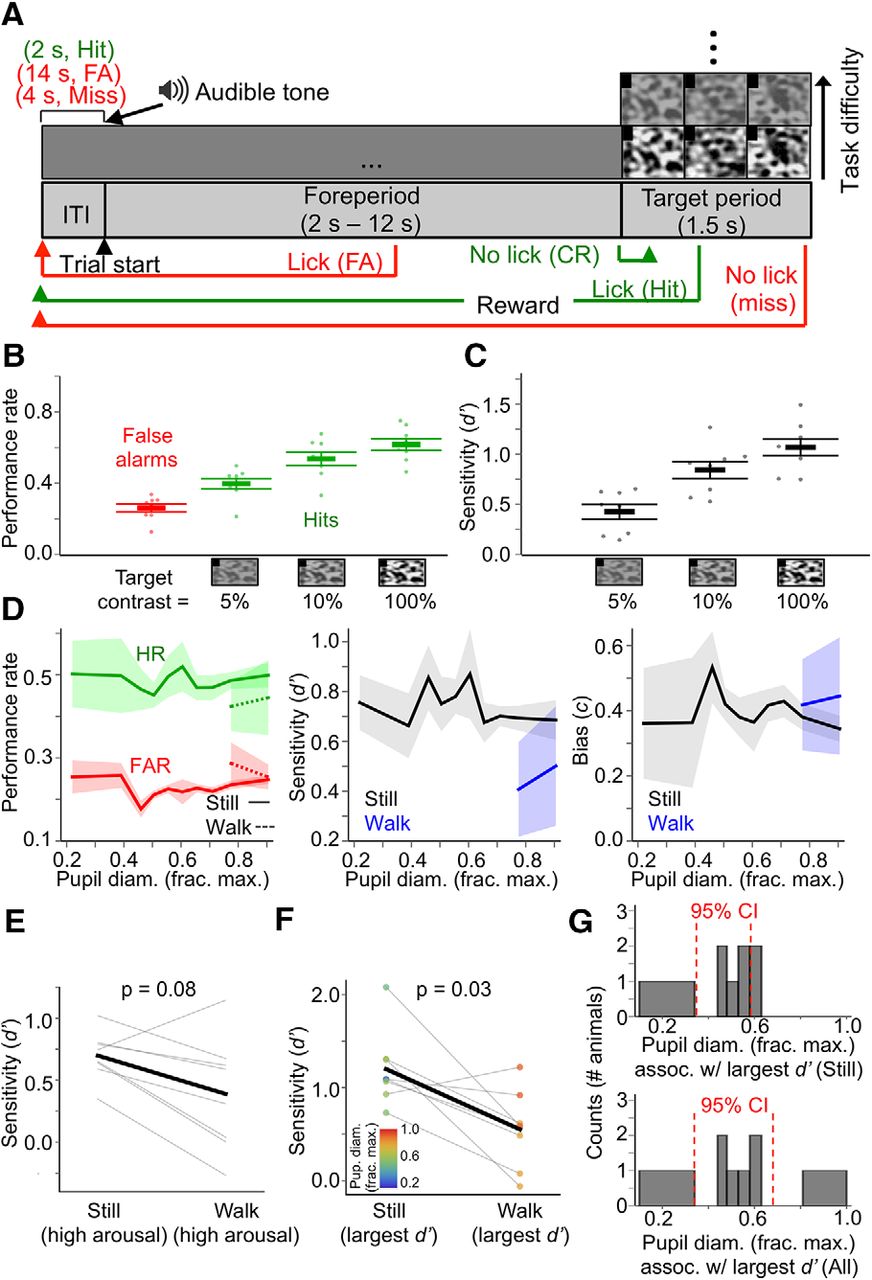
Visual detection of Gaussian noise movies is suboptimal during locomotion. A, Trial structure of the task. Each trial begins with a variable-duration foreperiod (signaled by an audible tone) consisting of an isoluminant gray screen, during which the mouse must withhold licking. Mice must lick during the target period, in which a Gaussian noise movie is presented at different contrasts. Note that for display purposes, the aspect ratio of the visual stimulus screen in the figure is different from that of the actual LCD monitor. B, Overall performance rates (false alarm rates and hit rates) across animals for the different target levels presented during behavior sessions. C, Overall perceptual sensitivities (d′) across animals for the different target levels presented during behavior sessions. D, Performance rate, perceptual sensitivity (d′), and decision bias (c) as a function of baseline pupil diameter, and sorted by locomotion status. E, Within-animal comparisons of d′ for stillness versus locomotion during high arousal (i.e., pupil diameter bins in which locomotion occurred). p-value is from rank-sum test. F, Within-animal comparisons of the largest d′ prime recorded during stillness versus locomotion. Data points are colored according to the pupil diameter bin in which they were recorded. p-value is from rank-sum test. G, Histograms (counts = number of animals) of the pupil diameter bin in which the largest d′ was recorded for each animal during stillness (top) and during stillness and locomotion combined (bottom). For pupil diameter bins in D and G, bin widths were chosen such that an equal amount of data fell into each bin. For D and G, 95% CIs are from bootstrap resampling (10,000 times) of values within bins. (N = 8 animals, n = 59 sessions; data are shown as mean ± 68% CI).


