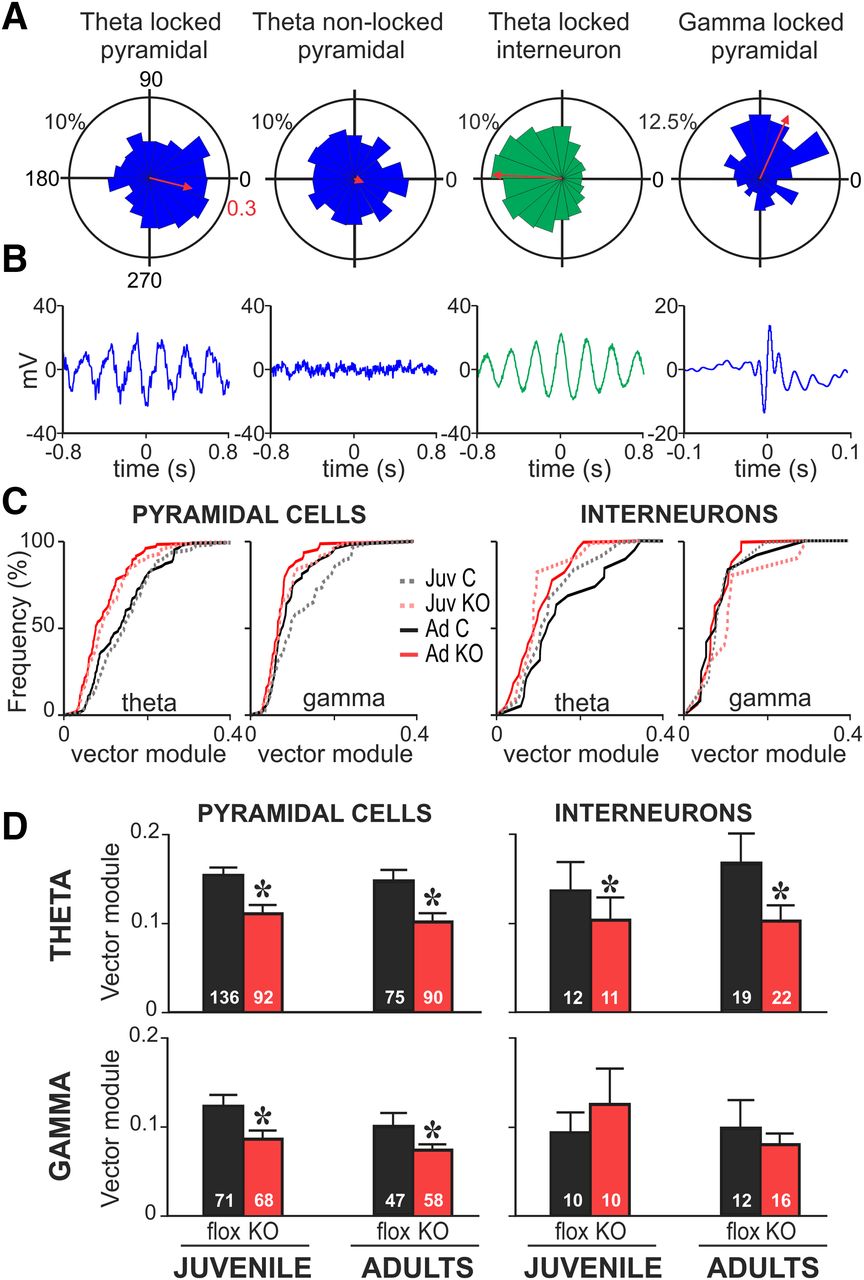
Phase-locking of mPFC neurons to local and distal rhythms is decreased in juvenile and adult NMDAR-KO mice. A, Representative examples of circular phase plots representing the occurrence of spike discharges (radial axis) as a function of LFP oscillation phase (angular axis) for 4 representative mPFC cells. Bin size 20°. Examples include pyramidal cells (blue) and interneurons (green) locked and not phase-locked to hippocampal theta or cortical γ rhythms. Red arrows indicate the resultant vector of the circular phase distribution. Red numbers indicate the radial axes for vector module. Left, First example presents a pyramidal cell phase-locked to hippocampal theta rhythm as evidenced by a nonuniform circular distribution (Rayleigh test, p < 0.001). B, Spike-triggered LFP average for each of the neurons plotted in A. STAs from phase-locked units reproduce the underlying oscillation. C, Cumulative frequency distributions of phase-locking strength to vHP theta and cortical γ oscillations for all phase-locked (Rayleigh, p < 0.05) pyramidal and interneurons from juvenile (Juv) and adult (Ad) control (C) and NMDAR-KO mice (KO). D, Phase-locking strength is represented as the average vector module for all phase-locked neurons (Rayleigh, p < 0.05) for each experimental group. Irrespective of age, neurons from KO mice show a decreased phase-locking to hippocampal theta rhythm (two-way ANOVA, genotype factor pyramidal: *p < 0.0001; interneurons: *p = 0.018). Pyramidal cells from KO mice displayed significant lower locking to cortical γ LFP oscillation at both ages (two-way ANOVA, pyramidal: genotype factor, *p < 0.0001). No changes were observed for interneurons in relation to γ rhythm (two-way ANOVA, genotype factor: p = 0.67). No significant interactions between age and genotype factors were detected by two-way ANOVAs in the statistical analysis. Data are mean ± SEM of n cells indicated in the graph bars from 11 juvenile control, 7 juvenile KO, 6 adult control, and 6 adult KO mice.


