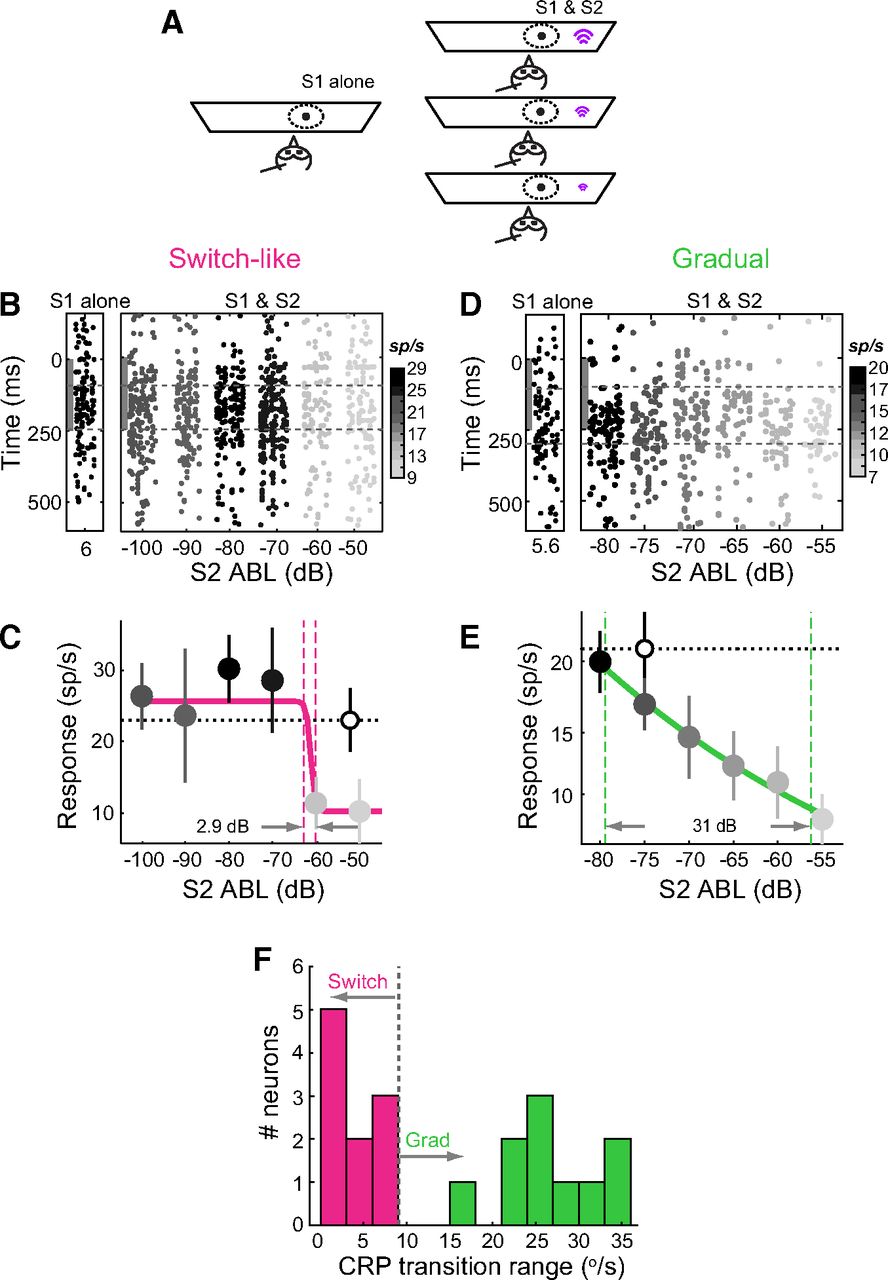
Switch-like and gradual response suppression of Imc neurons by an auditory competitor. A, Schematic of experimental setup and stimulus protocol for measuring auditory competitor response profiles (conventions are as in Fig. 1A). Black dot, S1 visual looming stimulus; magenta sound symbol, S2aud; size of symbol represents binaural intensity of S2aud. B, C, Switch-like auditory competitor response profile measured at an example Imc neuron. B, Response rasters. Dashed lines, time window (100–250 ms) during which response firing rates were calculated. S1 loom speed = 6°/s. C, Spike counts. Correlation coefficient of versus S2aud strength = −0.82 (p = 0.04, Pearson correlation test); r2 = 0.98 for the best fitting sigmoid, transition range = 2.9 dB. All other conventions are as in Figure 1, B and C. D, E, Gradual auditory competitor response profile measured at an example Imc neuron. D, Rasters. Dashed lines, Time window (100–300 ms) during which response firing rates were calculated. S1 loom speed = 5.6°/s. E, Spike counts. Correlation coefficient of responses versus S2aud strength = 0.99 (p = 0.00008, Pearson correlation test), r2 = 0.99 for the best fitting sigmoid, transition range = 31 dB. All other conventions as in Figure 1, D and E. F, Histogram of transition ranges of competitor response profiles recorded in Imc that exhibited a negative correlation with the strength of S2aud (n = 20 neurons/35 total). Vertical line: “cutoff” transition range of 9 dB (Materials and Methods). The median strength of S1 was 5.6°/s; 95% CI: 5.1°/s, 6.1°/s. Grad, Gradual; Switch, switch-like.


