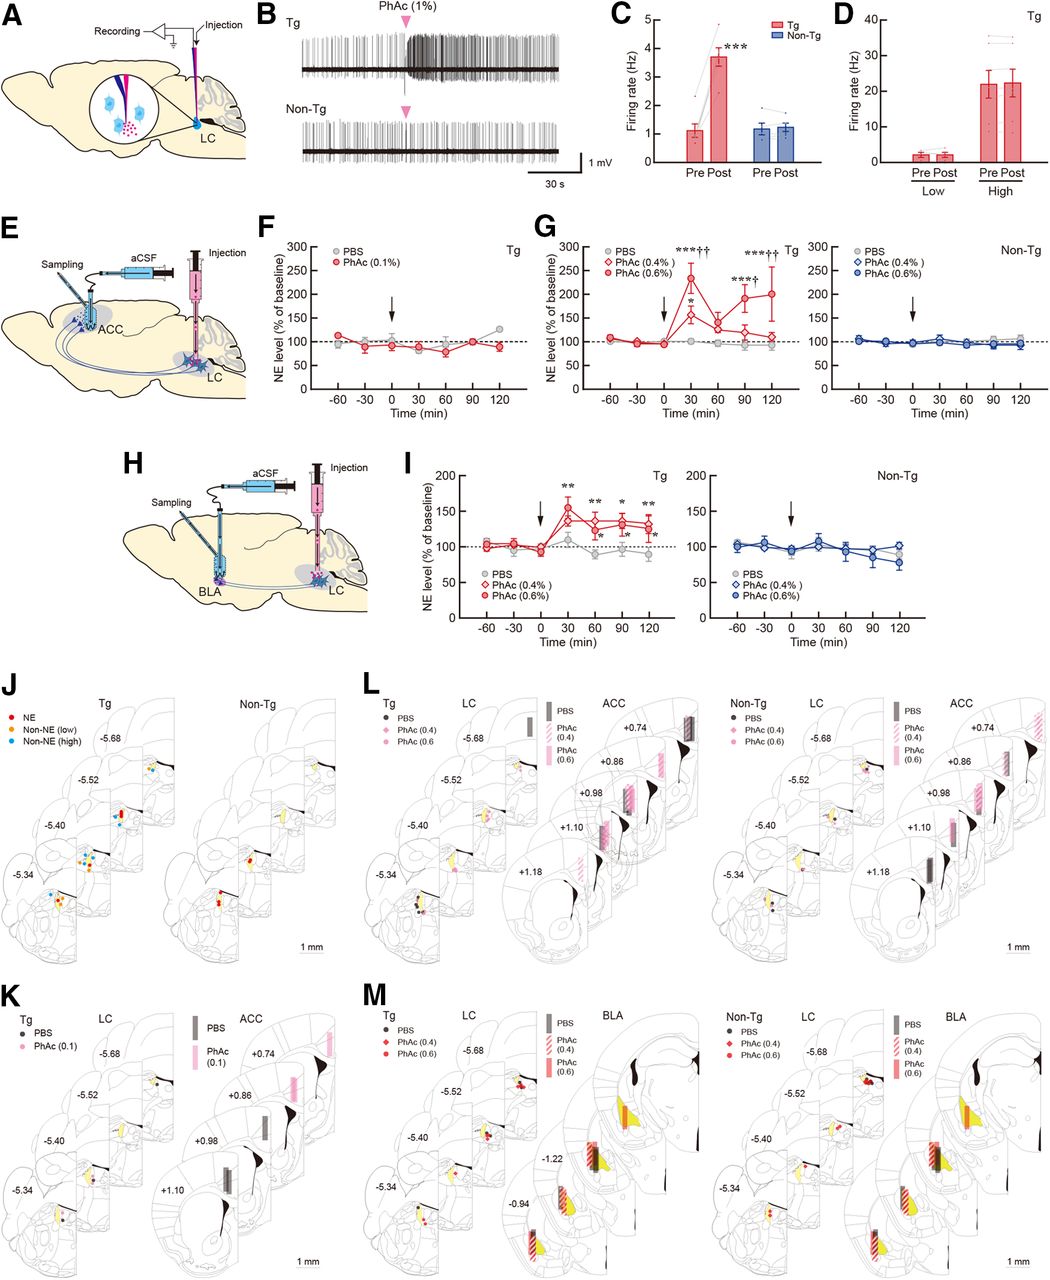
In vivo LC activation and increased NE release in the Tg mice. A, Schematic diagram for the strategy of single-unit recording for in vivo electrophysiology. PhAc solution (1%) was pneumatically injected through a glass capillary attached to the recording electrode. B, Firing pattern of an identified NE neuron in the Tg (top) and non-Tg (bottom) mice. The timing of the PhAc injection is indicated. C, Firing rate in the pre- and post-PhAc injection period for the Tg (n = 6) and non-Tg (n = 5) mice. ***p < 0.001 (paired two-tailed t test). D, Firing rate of non-NE neurons in the Tg mice with low and high frequency of the activity in the pre- and post-PhAc injection period (n = 5 or 7 for each type). E, Diagram for the microdialysis for measuring NE release in the ACC in response to LC activation. PhAc solution or PBS was injected into the LC, and dialysis samples were collected from the ACC. F, G, Changes in the extracellular NE level after injection for PhAc (0.2 μl/site) of 0.1% in the Tg mice (F) and 0.4%/0.6% in the Tg and non-Tg mice (G). NE levels are expressed as a percentage of the average baseline levels of each mouse. n = 3 for the 0.1% PhAc experiment, and n = 5 or 6 for each group of the 0.4% and 0.6% PhAc experiments. *p < 0.05, ***p < 0.001 versus PBS; †p < 0.05, ††p < 0.01 versus 0.4% PhAc (Holm–Bonferroni test). H, Diagram for the microdialysis for monitoring NE release in the BLA in response to LC stimulation. PhAc solution or PBS was injected into the LC, and dialysis samples were collected from the BLA. I, Changes in the extracellular NE level after 0.4%/0.6% PhAc injection (0.2 μl/site) in the two kinds of mice. NE levels are expressed as a percentage of the average baseline levels of each mouse. n = 5 or 6 for each group. *p < 0.05, **p < 0.01 versus PBS (Holm–Bonferroni test). Data are presented as the mean ± SEM. J, Placement sites of the recording electrodes (NE and non-NE neurons with low and high frequency) for in vivo electrophysiology. K, L, Placement sites of the injection needles into the LC and dialysis probes into the ACC after treatment with PBS and PhAc of 0.1% (K) or 0.4%/0.6% (L). M, Placement sites of the injection needles into the LC and dialysis probes into the BLA after treatment with PBS and PhAc (0.4%/0.6%). The AP coordinates (in mm) are shown. Scale bar, 1 mm.


