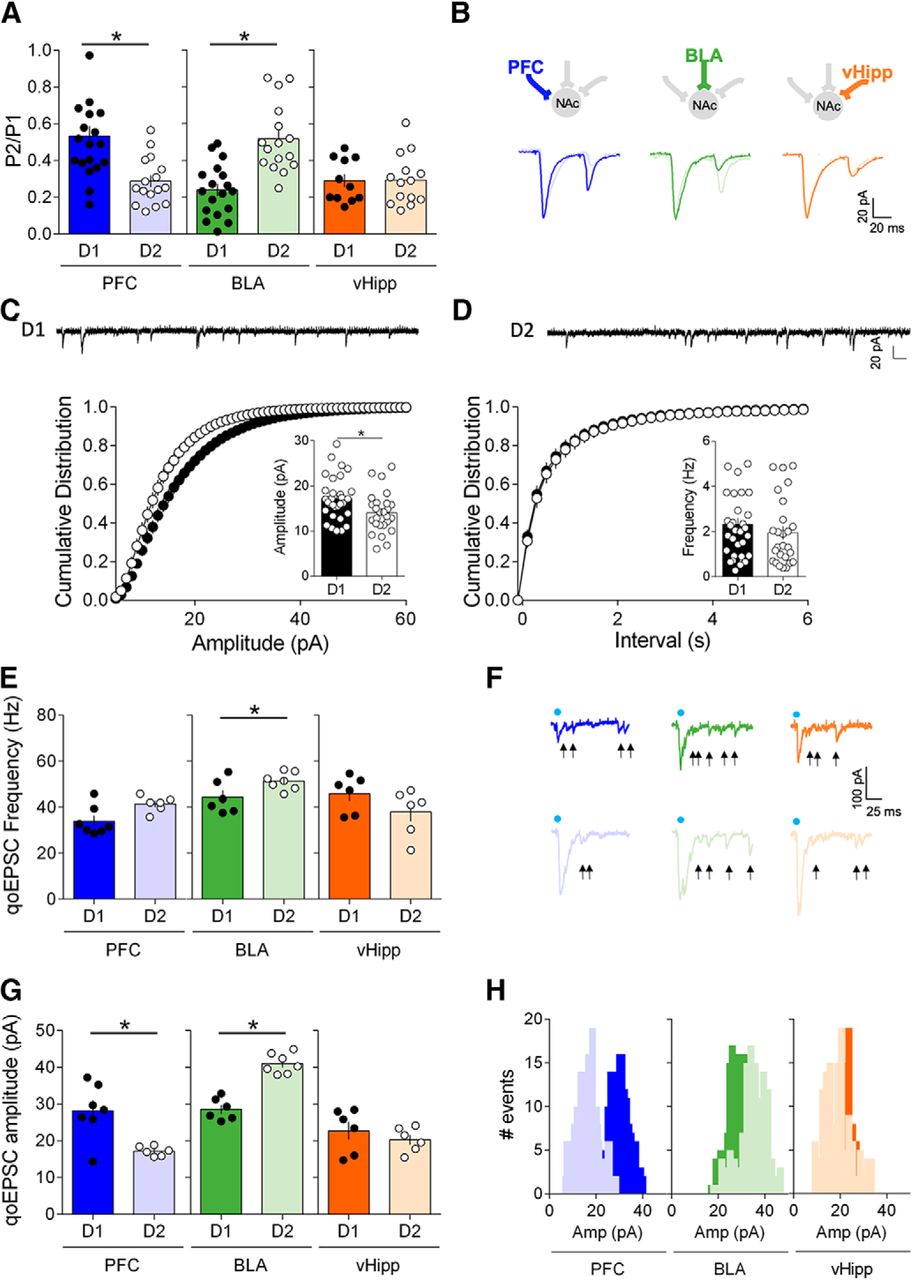
Input- and cell-type-specific postsynaptic and presynaptic properties in the NAc core. A, Average paired-pulse ratio (P2/P1) measured in D1 and D2 MSNs (voltage-clamp, −70 mV) in response to paired optical stimulations (50 ms interval) of PFC, BLA and vHipp inputs. PFC inputs had a lower PPR/high release probability in D2 MSNs (light blue) compared with D1 MSNs (dark blue) (D1 MSNs n = 12, D2 MSNs n = 19, p = 0.0006, Mann–Whitney U test). BLA inputs had a lower PPR/high release probability in D1 MSNs (dark green) compared with D2 MSNs (light green) (D1 MSNs n = 16, D2 MSNs n = 18, p < 0.0001, Mann–Whitney U test). vHipp inputs exhibited similar release probability in both D1 (dark orange) and D2 MSNs (light orange) (vHipp: D1 MSNs n = 15, D2 MSNs n = 11, p > 0.9999, Mann–Whitney U test). B, Example traces of evoked paired oEPSC responses to optical stimulations of PFC, BLA and vHipp inputs recorded in D1 MSNs and D2 MSNs. C, Cell-type-specific differences in amplitude of sEPSCs in adult core MSNs: Representative traces of whole-cell voltage-clamp recording AMPAR event sEPSC from in D1 and D2 MSNs. D, Left, Cumulative probability plot of measured sEPSC event amplitudes. Summary bar chart shows mean AMPAR event sEPSC amplitude (D1 MSNs: n = 32; D2 MSNs: n = 26, p = 0.0146, Mann–Whitney U test). Right, Cumulative probability plot of interval between measured sEPSC events. Scatter dot plots represents one cell. Summary bar chart shows mean AMPAR event sEPSC interval. E, Light-evoked input-specific quantal EPSCs (qoEPSC) in the adult NAc. At BLA inputs, qoEPSCs frequencies were larger in D2 MSNs compared with D1 MSNs (D1 MSNs n = 6, D2 MSNs n = 7, p = 0.0734, Mann–Whitney U test). At PFC and vHipp inputs, qoEPSCs frequencies were similar in D1 MSNs and D2 MSNs (PFC: D1 MSNs n = 7, D2 MSNs n = 6, p = 0.0361; vHipp: D1 MSNs n = 6, D2 MSNs n = 6, p = 0.1429, Mann–Whitney U test). F, Representative qoEPSCs recorded in D1 MSNs and D2 MSNs in response to pathway specific opto-stimulation (arrows indicate detected qoEPSCs). G, At PFC inputs, qoEPSCs amplitudes were larger in D1 MSNs compared with D2 MSNs (D1 MSNs n = 7, D2 MSNs n = 6, p = 0.0350, Mann–Whitney U test). At BLA inputs, qoEPSCs amplitudes were larger in D2 MSNs compared with D1 MSNs (D1 MSNs n = 6, D2 MSNs n = 7, p = 0.0012, Mann–Whitney U test). At vHipp inputs, qoEPSC amplitudes were similar in D1 MSNs and D2 MSNs (D1 MSNs n = 6, D2 MSNs n = 6, p = 0.1429, Mann–Whitney U test). H, Histograms for representative D1 cells and D2 cells showing the distribution of qoEPSC amplitude across all trials. Blue dots indicate optical stimulations. Individual point in scatter dot plots represents one individual neuron. All data are shown as mean ± SEM. *p < 0.05.


