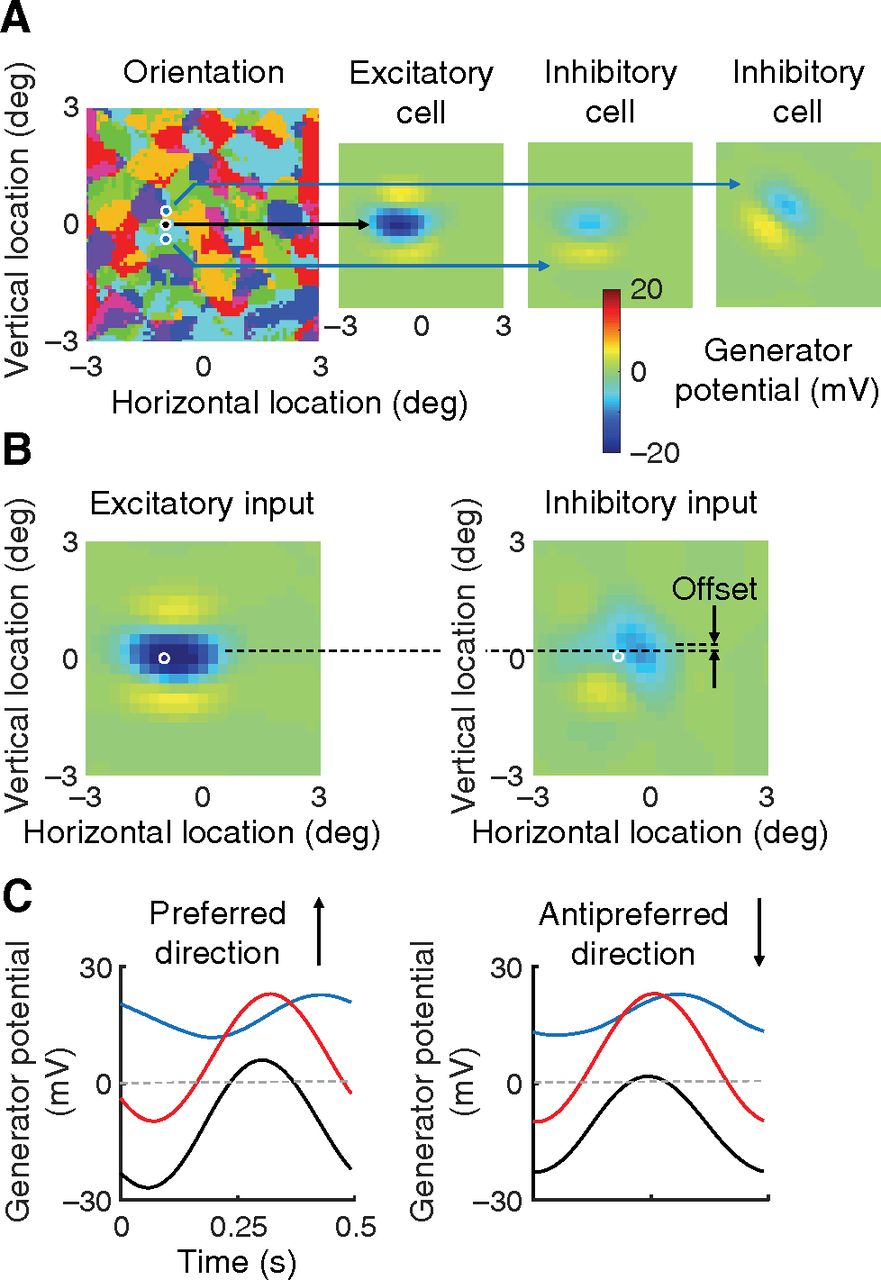
Receptive fields. A, The orientation preference map for all excitatory cells in the visual field are shown in the map at left. Black dot on the map gives the location of the direction-selective cell in Figure 3A. Blue dots represent the locations of two nearby inhibitory cells. Right, The receptive fields of these three cells. These fields were obtained by presenting stimulus squares at a variety of visual field locations. The field obtained with dark squares is subtracted from that obtained with light squares. The response measure is generator potential, for comparison with B. The inhomogeneity of inhibitory inputs to the excitatory cell is clear: the inhibitory receptive fields differ markedly from each other. B, Receptive fields of the summed excitatory and summed inhibitory inputs to the excitatory cell in A are shown on the left and right sides, respectively. The spatial offset between the two receptive fields is indicated. C, These time courses are copied from Figure 4A to illustrate more fully the mechanism of direction selectivity.


