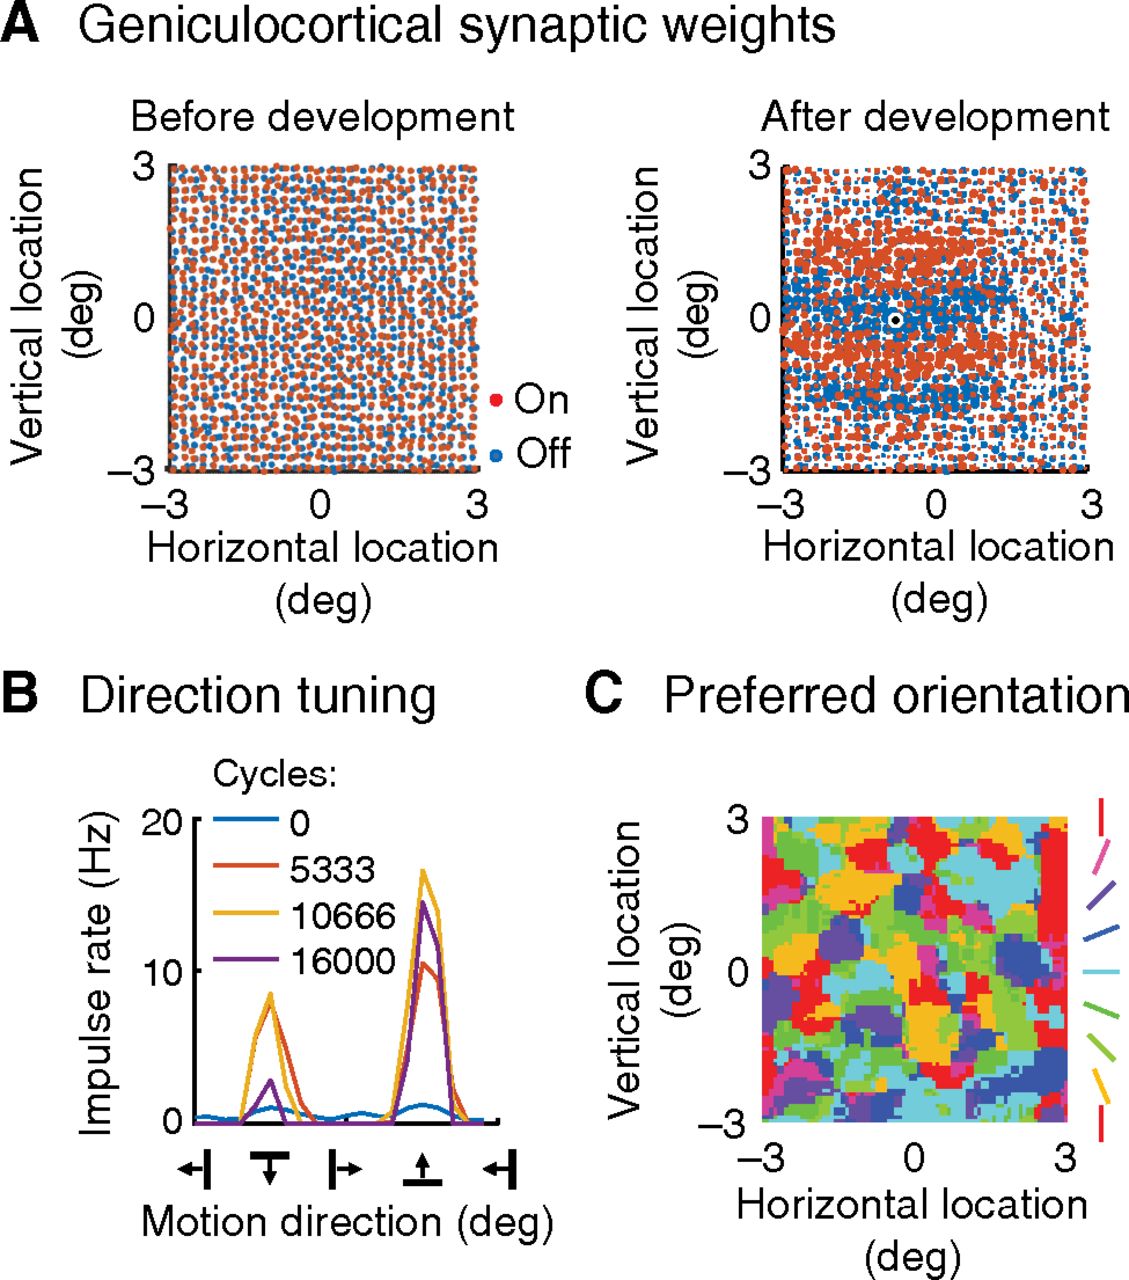
Development of orientation selectivity. A, The model takes its inputs from an  area of visual field, of which
 is displayed. Left, Red and blue dots represent, respectively, on- and off-center retinal ganglion cells. The statistics
of the array match published accounts. The development process, described in Materials and Methods, altered geniculocortical
synaptic strengths. Right, Map represents the postdevelopment strength of the synapse between the channel driven by each retinal
ganglion cell and the cortical neuron located at the black spot: synaptic strength is indicated by red and blue spot size.
A Hebbian process has segregated on- and off-inputs into orientated bands. B, The model was stimulated with drifting gratings whose direction is shown on the horizontal axis, and the vertical axis indicates
the response amplitude of the cortical neuron whose synaptic strengths are shown in A (right). Four cycles of the development process are shown, with one line for each cycle. Response amplitude and orientation
selectivity increase with development. C, Cortical neurons were orientation-selective across the visual field: this map shows preferred orientation for each neuron.
The orientation preferred is determined by clumping of on- and off-center retinal ganglion cells (Nguyen and Freeman, 2019).


