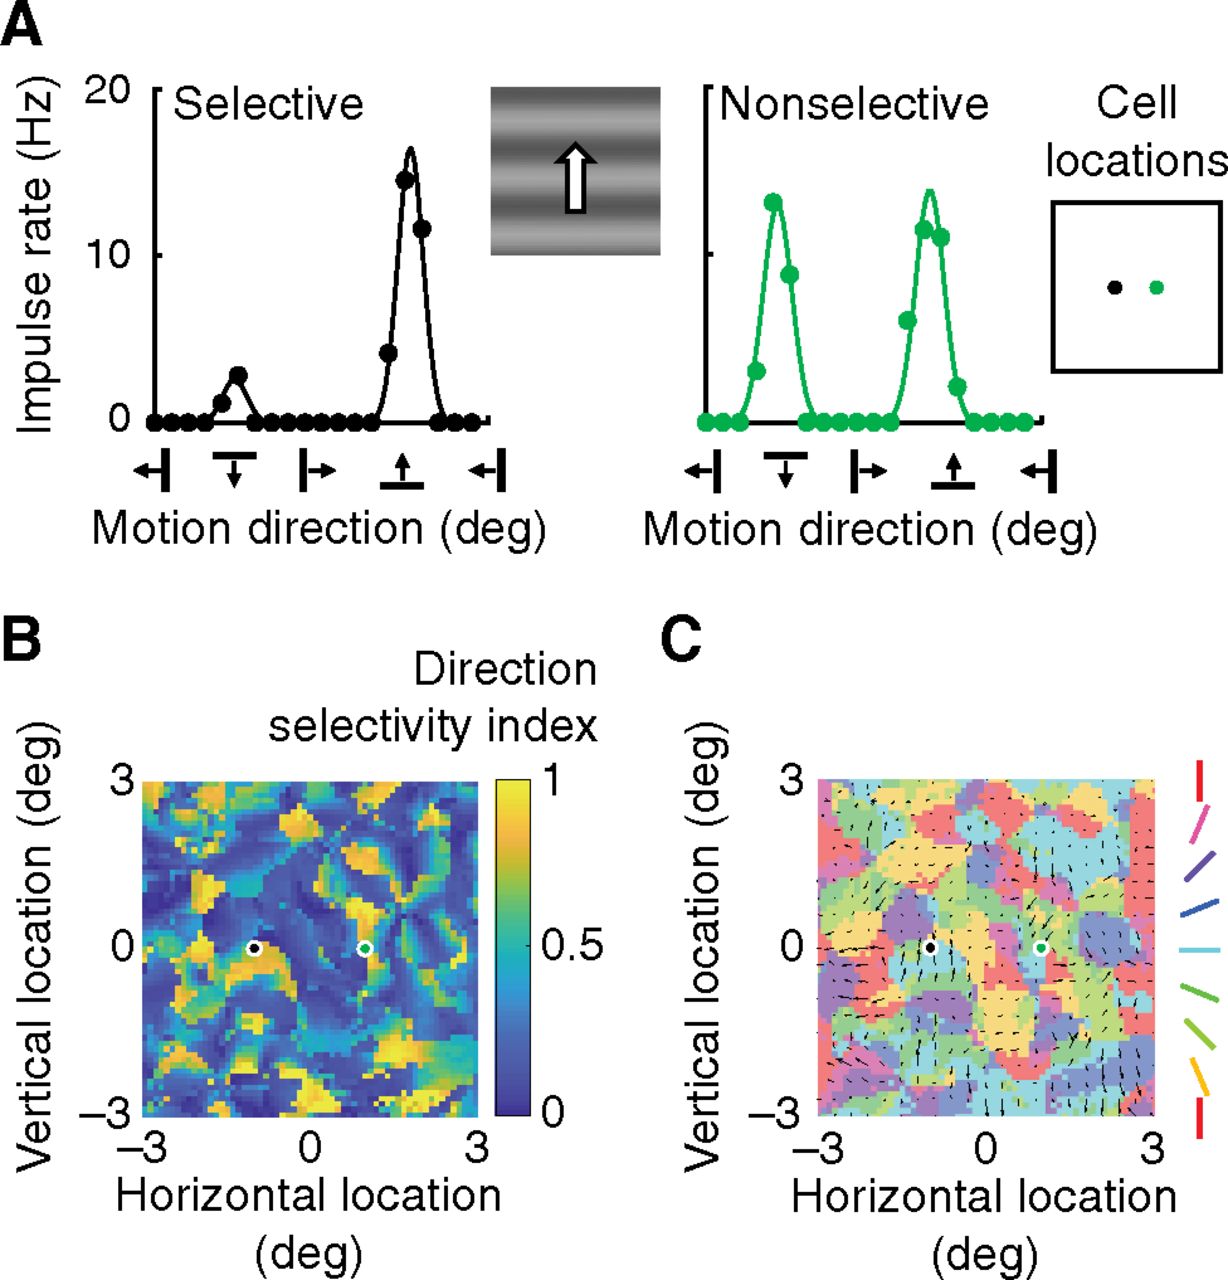
Direction selectivity. A, Cortical neurons were stimulated with drifting gratings over the full range of directions. Vertical axes indicate the fundamental Fourier amplitude of the resulting impulse rate. The cell at left is direction-selective in that it responds best to upward movement and poorly to the opposite direction. The cell at right is nonselective in that its responses in opposite directions are almost equal. Right, Inset, The locations of the two cells within the visual field. B, The map represents the DSI of every excitatory cell; the index, color coded as shown in the key at right, varies between 0 (nonselective) and 1 (zero response in the antipreferred direction). Selectivity is patchy. Black and green dots represent the location of the cells in A. C, A map of preferred direction is shown, where the direction is shown by the arrows and the DSI is given by arrow length. The arrows are superimposed on the map of preferred orientation; this is a desaturated copy of the map in Figure 2C.


