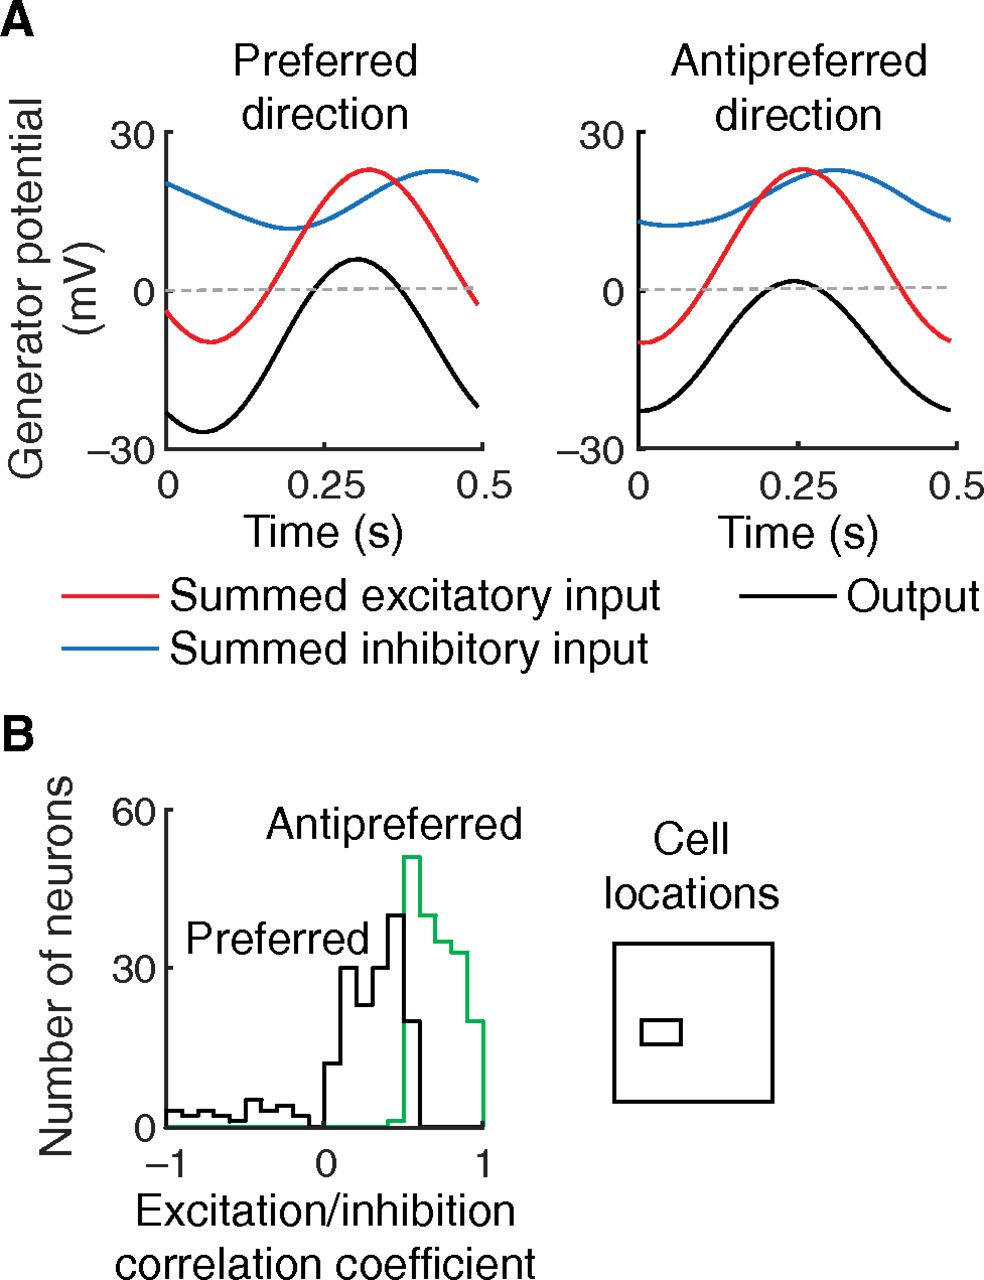
Generator potential time course. A, The responses shown belong to one cortical neuron (the direction-selective cell in Fig. 3A) stimulated with a drifting grating moving in the preferred and opposite directions on the left and right, respectively. Responses are cyclic, and one period of the cycle is shown. The three curves on each graph indicate the summed excitatory input, summed inhibitory input, and output in red, blue, and black, respectively. The output, which is approximately the difference between the excitatory and inhibitory inputs, is closer to the action potential threshold (dashed line) for the antipreferred direction. Cell output in the antipreferred direction is smaller because the excitatory and inhibitory inputs are more closely correlated. B, Histograms represent the coefficient of the correlation between the two inputs for the two stimulus directions. The sampled cells come from a visual field area in which direction selectivity is high, as shown by the inset.


