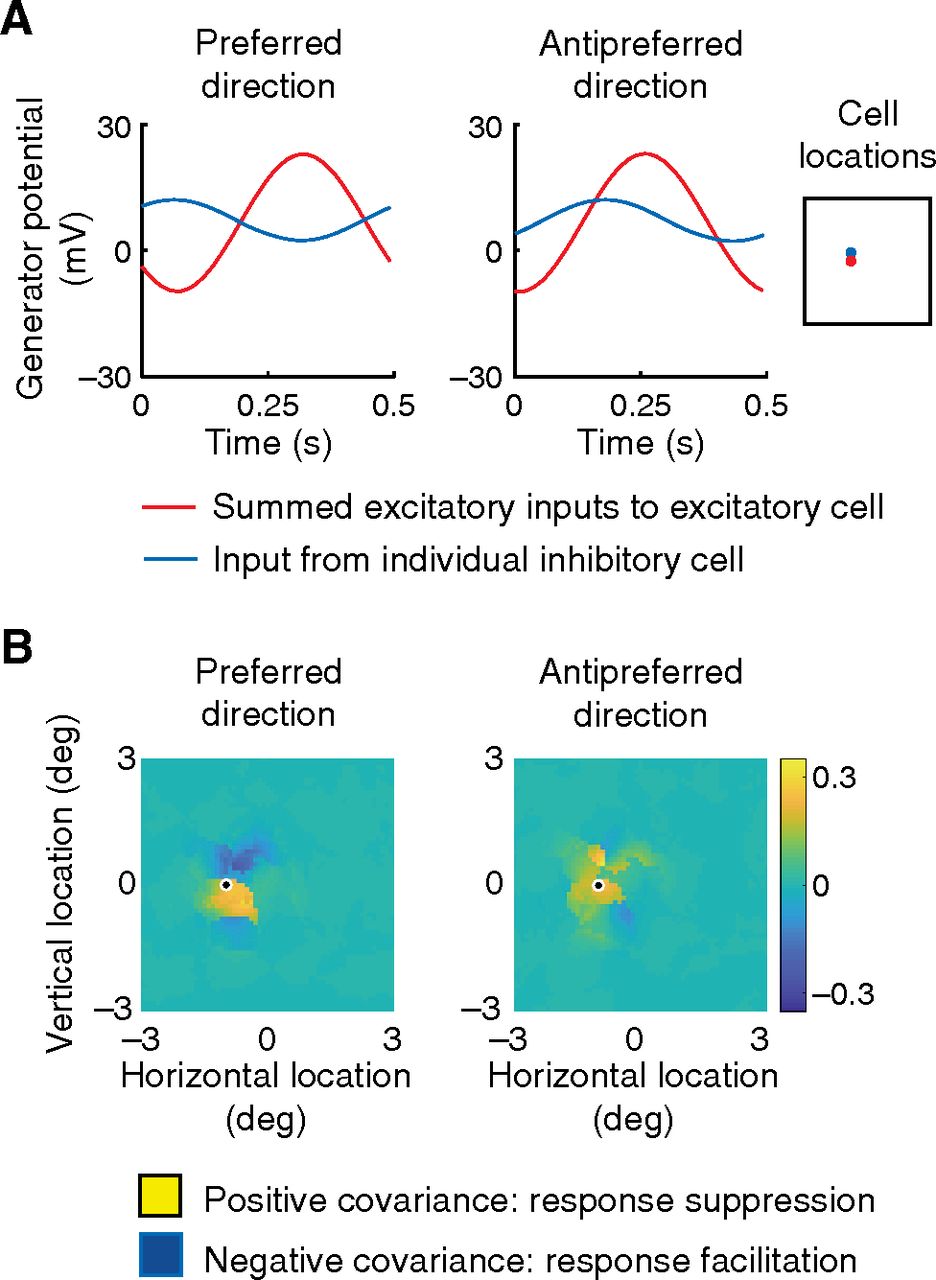
Maps of inhibition. A, Inset, Location of an excitatory cell (the direction-selective cell shown in Fig. 3A) and inhibitory cell in red and blue, respectively. The time courses give generator potential for the summed excitatory inputs to the excitatory cell (red) and the input from the inhibitory cell (blue). Responses to the preferred and opposite directions of a drifting grating are shown at left and right, respectively. The excitatory and inhibitory inputs are negatively or positively correlated, depending on direction. B, Maps represent the covariance of the two inputs to the excitatory cell in A for every inhibitory cell in the visual field. The location of the cell is circled. Covariances are weighted with a Gaussian function of distance from the excitatory cell. The biggest difference in covariance for the two directions of stimulus movement is in the upper field, consistent with the data in Figure 6B.


