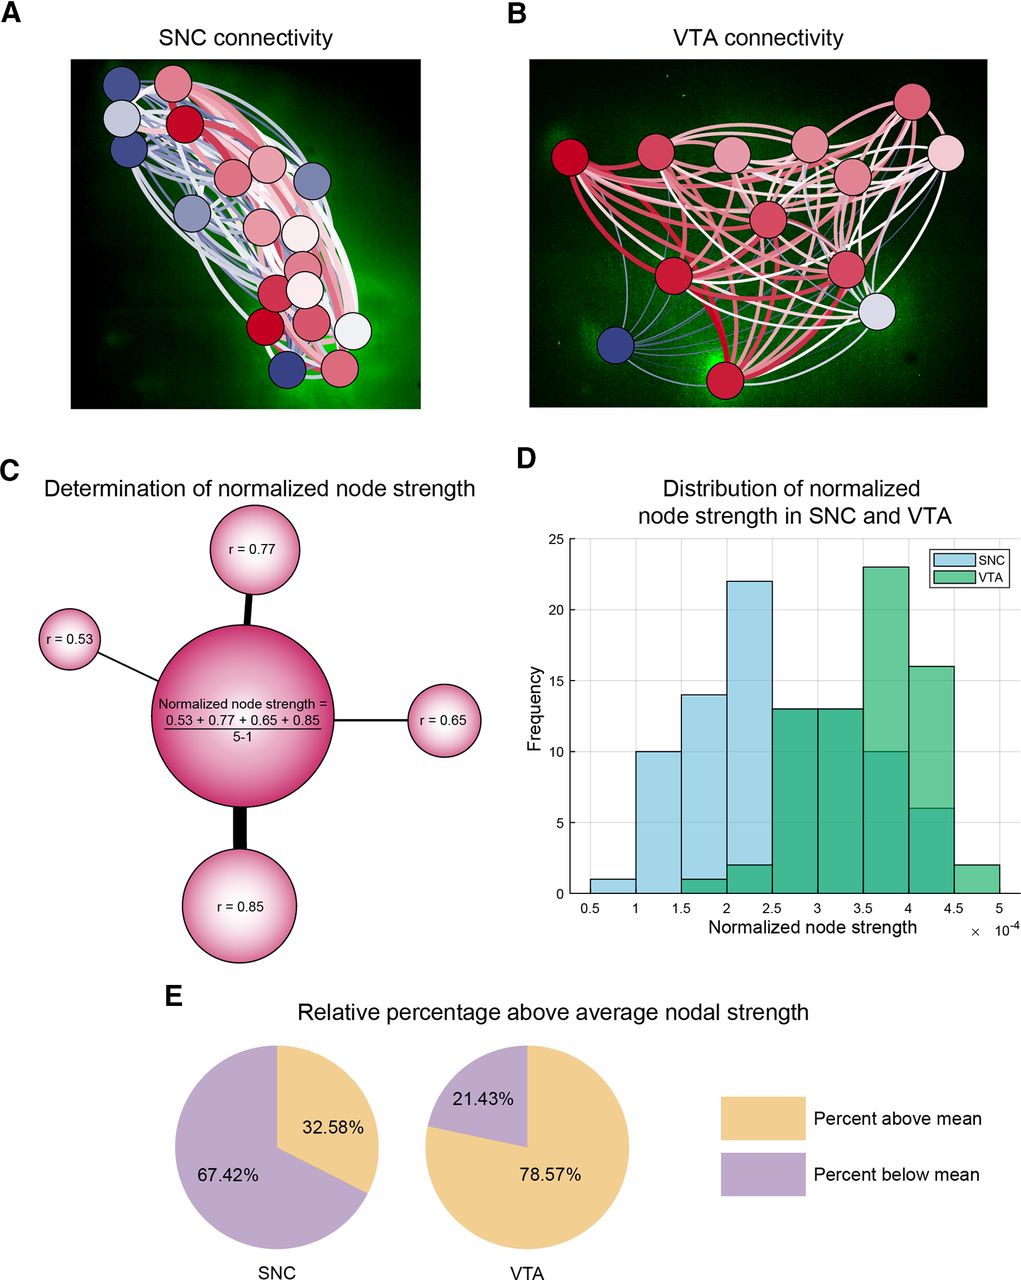
VTA dopaminergic networks are more strongly interconnected than the SNC. A, B, XY-projection network graph of the functional connectivity matrices overlaid on SNC and VTA suggest differences in connection strength distributions. Connection strength, a neuron's relative contribution to the network, is displayed through coloration (blue = minimum, white = mean, red = high). Neurons are overlaid with circles representing their weighted degree (node strength, blue = minimum, white = mean, red = high). Scales reflect distribution within the investigated network. C, Normalized node strength is determined through integrating the magnitude of the correlation values of each neuron to all other neurons within the network, and then normalized by dividing by N – 1, where N = total number of neurons within the network. D, VTA neurons tend to exhibit larger normalized node strength values with a right skewed distribution while SNC exhibit a more Gaussian-like distribution centered on a lower value [mean normalized node strength (n) = 3.97 (89 neurons), SNC, 5.24 (70 neurons), VTA, two-tailed unpaired t test, p = 1.89 × 10⁻⁹]. Node strengths are pooled for each region from five to eight slices from five animals. E, Normalized node strength values were pooled for midbrain average node strength and then neurons were classified whether they exceeded or fell below this value. The VTA exhibits a significantly greater proportion of neurons exceeding this average midbrain node strength than SNC (78.57%, VTA; 32.58%, SNC; two-tailed unpaired t test, p = 3.80 × 10⁻¹³).


