Subcellular Distribution of Persistent Sodium Conductance in Cortical Pyramidal Neurons
- Arik Shvartsman1,
- Oron Kotler1,
- Ohad Stoler1,
- Yana Khrapunsky1,
- Israel Melamed2, and
- Ilya A. Fleidervish1
- 1Department of Physiology and Cell Biology, Faculty of Health Sciences and Zlotowski Center for Neuroscience, Ben–Gurion University of the Negev, Beer Sheva 84105, Israel
- 2Department of Neurosurgery, Faculty of Health Sciences and Zlotowski Center for Neuroscience, Ben–Gurion University of the Negev, Beer Sheva 84105, Israel
-
Author contributions: I.M. and I.A.F. designed research; A.S., O.K., O.S., and Y.K. performed research; A.S., O.K., O.S., Y.K., I.M., and I.A.F. analyzed data; I.M. and I.A.F. wrote the paper.
Abstract
Cortical pyramidal neurons possess a persistent Na+ current (INaP), which, in contrast to the larger transient current, does not undergo rapid inactivation. Although relatively quite small, INaP is active at subthreshold voltages and therefore plays an important role in neuronal input–output processing. The subcellular distribution of channels responsible for INaP and the mechanisms that render them persistent are not known. Using high-speed fluorescence Na+ imaging and whole-cell recordings in brain slices obtained from mice of either sex, we reconstructed the INaP elicited by slow voltage ramps in soma and processes of cortical pyramidal neurons. We found that in all neuronal compartments, the relationship between persistent Na+ conductance and membrane voltage has the shape of a Boltzmann function. Although the density of channels underlying INaP was about twofold lower in the axon initial segment (AIS) than in the soma, the axonal channels were activated by ∼10 mV less depolarization than were somatic channels. This difference in voltage dependence explains why, at functionally critical subthreshold voltages, most INaP originates in the AIS. Finally, we show that endogenous polyamines constrain INaP availability in both somatodendritic and axonal compartments of nondialyzed cortical neurons.
SIGNIFICANCE STATEMENT The most salient characteristic of neuronal sodium channels is fast inactivation. However, a fraction of the sodium current does not inactivate. In cortical neurons, persistent current (INaP) plays a prominent role in many important functions. Its subcellular distribution and generation mechanisms are, however, elusive. Using high-speed fluorescence Na+ imaging and electrical recordings, we reconstructed the INaP in soma and processes of cortical pyramidal neurons. We found that at near-threshold voltages INaP originates predominately from the axon, because of the distinctive voltage dependence of the underlying channels and not because of their high density. Finally, we show that the presence of endogenous polyamines significantly constrains INaP availability in all compartments of nondialyzed cortical neurons.
Introduction
Somata and processes of cortical pyramidal neurons contain an inhomogeneously distributed mixture of molecularly distinct voltage-gated Na+ channels (Bean, 2007). Fast-inactivating current through these channels plays a central role in the initiation and propagation of action potentials (Hodgkin and Huxley, 1952; Stuart and Sakmann, 1994). In addition to this transient current, which is largely turned off by the time the peak of the spike is achieved (Alle et al., 2009; Carter and Bean, 2009; Hallermann et al., 2012), a more slowly inactivating, persistent component has been identified (Connors et al., 1982; Stafstrom et al., 1982; Crill, 1996). Despite its relatively small amplitude, persistent Na+ current (INaP) plays a prominent role in many important neuronal functions. Among these are setting the spike threshold (French et al., 1990), the “boosting” of EPSPs (Deisz et al., 1991; Stuart and Sakmann, 1995) and IPSPs (Stuart, 1999), regulating the frequency of repetitive firing and neuronal gain (Stafstrom et al., 1985; French et al., 1990; Kuo et al., 2006), shaping afterpotentials and burst firing (Yue et al., 2005), subthreshold oscillations (Hutcheon and Yarom, 2000), and pacemaking (Taddese and Bean, 2002). A recent study showed that in the CA1 area of hippocampus, INaP-mediated amplification of spatially modulated synaptic responses is responsible for rapid and reversible conversion between silent cells and place cells (Hsu et al., 2018). Evidence indicates that a pathologic increase in INaP generation plays an important role in epileptogenesis (for review, see Stafstrom, 2007; Wengert and Patel, 2021). Thus, numerous sodium channelopathies cause epilepsy by affecting INaP (Kearney et al., 2001; Lossin et al., 2002).
In cortical pyramidal cells, the characteristics of Na+ channels, including their density (Kole et al., 2008; Fleidervish et al., 2010), voltage dependence (Colbert and Pan, 2002; Hu et al., 2009), and their propensity to generate persistent Na+ current (Stuart and Sakmann, 1995; Astman et al., 2006; Fleidervish et al., 2010), differ from site to site within a single neuron. It is difficult to investigate these spatial differences using electrical recordings alone. Here, we used a combination of whole-cell patch-clamp recording and high-speed fluorescence imaging of [Na+]i changes to explore compartmental differences in the density and kinetics of the channels responsible for INaP in the soma and processes of layer 5 (L5) pyramidal neurons.
Our measurements of Na+ fluxes in the axon, soma, and proximal apical dendrites of cortical pyramidal cells suggest that there is little difference in noninactivating Na+ channel densities between these regions. Our results indicate that, at the functionally critical subthreshold range of voltages, INaP is primarily generated in the proximal axon, reflecting the distinctive voltage dependence of the underlying channels. Finally, they strongly suggest that in all neuronal compartments, the availability of Na+ channels responsible for INaP is controlled by local concentration of endogenous polyamines (Huang and Moczydlowski, 2001; Fleidervish et al., 2008; Fu et al., 2012).
Materials and Methods
Ethics statement
This study was conducted at the Ben-Gurion University of the Negev in accordance with the recommendations of guidelines for the welfare of experimental animals. Animal experiments were approved by the Institutional Animal Care and Use Committee of Ben-Gurion University.
Generation of transgenic mice
Transgenic mice having a tamoxifen-inducible Cre-mediated recombination system driven by the Plp1 (proteolipid protein 1) promoter (catalog #005975, The Jackson Laboratory) were crossbred with transgenic mice expressing cell membrane-targeted EGFP reporter in Cre recombinase-expressing cells (catalog #007676, The Jackson Laboratory). In double transgenic offspring, induction of CRE by three daily oral administrations of 2 mg of tamoxifen (Sigma-Aldrich) starting at postanatal day 21 (P21) resulted in appearance of membrane targeted EGFP only in mature, myelin-expressing oligodendrocytes (Hill et al., 2014). Brain slices were prepared from mice age P30 to P56 of both sexes.
Slice preparation and whole-cell recording
Experiments were performed on L5 pyramidal neurons in mouse cortical sagittal slices using techniques described previously (Fleidervish et al., 2010; Katz et al., 2018). In most experiments, slices were prepared from the brains of P11 to P24 ICR mice of both sexes (Envigo). Some experiments were performed in brain slices from P28 to P56 double transgenic mice expressing membrane-targeted EGFP reporter in mature oligodendrocytes (see above). The younger mice were anesthetized with isoflurane and decapitated using procedures approved by the Institutional Animal Care and Use Committee. The older mice were anesthetized with ketamine hydrochloride and xylazine hydrochloride intraperitoneal injection, perfused intracardially with ice-cold artificial CSF (aCSF) and then decapitated. Slices (300 µm) were cut on a vibratome (model VT1200, Leica) and placed in a holding chamber containing oxygenated aCSF at room temperature; they were transferred to a recording chamber after at least 30 min of incubation. The composition of the aCSF was as follows (in mm): 124 NaCl, 3 KCl, 2 CaCl2, 2 MgSO4, 1.25 NaH2PO4, 26 NaHCO3, and 10 glucose (all chemicals obtained from Sigma Aldrich), at pH 7.4 when bubbled with 95% O2/CO2. The cells were viewed with a 40× or 60× water-immersion lens in a BX51WI Microscope (Olympus) mounted on an x–y translation stage (Luigs and Neumann). Somatic whole-cell recordings were made using patch pipettes pulled from thick-walled borosilicate glass capillaries (outer diameter, 1.5 mm; Science Products). The pipette solution for whole-cell voltage-clamp experiments contained the following (in mm): 135 CsCl, 2 MgCl2, 4 NaCl, and 10 HEPES, at pH 7.3 adjusted with CsOH (all chemicals obtained from Sigma Aldrich); and supplemented with 2 mm Na+-sensitive dye, sodium-binding benzofurane isophthalate (SBFI) tetraammonium salt (Thermo Fisher Scientific; Minta and Tsien, 1989). When filled with this solution, pipettes had resistance of 3–6 MΩ. Voltage-clamp recordings from L5 neurons visually identified using infrared-differential interference contrast optics (Stuart et al., 1993) were made with a MultiClamp 700B amplifier equipped with CV-7 headstage (Molecular Devices). Data were low-pass filtered at 2 kHz (−3 dB, four-pole Bessel filter) and digitized at 10 kHz using a Digidata 1322A digitizer driven by PClamp 9 software (Molecular Devices). Care was taken to maintain the access resistance as low as possible (usually, 6–7 MΩ, and always <10 MΩ); series resistance was 80% compensated using the built-in circuitry of the amplifier. Ca2+ currents were blocked by adding 200 µm Cd2+ to the bath. Voltages were not corrected for liquid junction potential. All recordings were made at 30°C.
Dynamic sodium measurements
Imaging experiments were performed as described previously (Baranauskas et al., 2013; Katz et al., 2018). SBFI fluorescence was excited by using a high-intensity LED device (385 ± 4 nm; Prizmatix), and the emission was collected by using a modified Olympus U-MNU2 filter set (400 nm dichroic mirror; 420 nm long pass-emission filter). The fluorescent response of SBFI was recorded using a back-illuminated 80 × 80 pixel cooled camera (NeuroCCDSMQ, RedShirt Imaging) at 500 frames/s acquisition speed controlled by Neuroplex software. Indicator bleaching was corrected by subtracting an equivalent blank trace without electrical stimulation.
Two-photon reconstruction of neuronal morphology and myelin
At the end of physiological recordings in brain slices from double transgenic mice expressing membrane-targeted EGFP reporter in mature oligodendrocytes, we placed the slice that contained the cell filled with SBFI in the aCSF-perfused chamber on the stage of a two-photon microscope (model Ultima IV, Bruker) equipped with a Mai Tai Deep See pulsed laser (Spectra-Physics). Using two-photon excitation at 740 nm, we found the SBFI-filled cell and placed it in the center of the field of a 40× or 60× Olympus water-immersion lens. We then focused on the cell and scanned dendrites, soma, and axon at 0.5–1.0 µm depth intervals. Myelinating processes of the nearby EGFP-expressing oligodendrocytes were scanned at 940 nm. The resulting z stacks were imported into ImageJ (National Institutes of Health) for reconstruction and image processing.
Data analysis
Electrophysiological data analysis was accomplished using pCLAMP10 software (Molecular Devices) and Origin 6.0 (OriginLab). If not otherwise noted, values are given as the mean ± SE. Student's t test was used for statistical analysis.
Modeling
Numerical simulations were performed in the NEURON simulation environment (Hines and Carnevale, 1997). Unless otherwise stated, electrophysiological parameters and dynamic [Na+]i changes were studied in a simplified compartmental model that encompassed the fundamental morphologic and electrical features of layer 5 pyramidal neurons, as described previously (Fleidervish et al., 2010; Baranauskas et al., 2013). In the model, the 1.2-µm-thick axon initial segment (AIS) extended over the first 50 µm of the axon, with the exception of models based on morphometric measurements of the AIS length (see Figs. 4, 5). The subsequent segment (length, 50 µm; diameter, 1.2 µm) was myelinated, with the exception of models based on morphometric measurements of the first internodal length (see Fig. 4). The soma (length, 23 µm; diameter, 23 µm) gave rise to a single apical dendrite (length, 700 µm; diameter, 3.5 µm) and to two basal dendrites (length, 200 µm; diameter, 1.2 µm). The passive electrical properties Rm (membrane resistance), Cm (membrane capacitance), and Ri (internal resistivity) were set to 15,000 Ω/cm2, 0.9 µF/cm, and 150 Ωcm, respectively, uniformly throughout all compartments. Myelination was simulated by reducing Cm to 0.02 µF/cm. The resting membrane potential at the soma was set to −75 mV. All simulations were run with 5 µs time steps, and the nominal temperature of simulations was 32°C.
The model incorporated a Hodgkin–Huxley-based persistent Na+ conductance, GNaP, with no inactivation variable and voltage dependence of activation based on experimental findings (see Fig. 7). The voltage-dependent rates of activation were defined as follows:
<mml:math display="block"><mml:mrow><mml:msub><mml:mi>α</mml:mi><mml:mrow><mml:mtext>soma</mml:mtext></mml:mrow></mml:msub><mml:mrow><mml:mo
                                       stretchy="true">(</mml:mo><mml:mi>V</mml:mi><mml:mo stretchy="true">)</mml:mo></mml:mrow><mml:mo>=</mml:mo><mml:mn>35.715</mml:mn><mml:mo>
                                       * </mml:mo><mml:msup><mml:mi>e</mml:mi><mml:mrow><mml:mo>−</mml:mo><mml:msup><mml:mrow><mml:mrow><mml:mo stretchy="true">(</mml:mo><mml:mrow><mml:mfrac><mml:mrow><mml:mi>V</mml:mi><mml:mo>−</mml:mo><mml:mn>23</mml:mn></mml:mrow><mml:mrow><mml:mn>50.45</mml:mn></mml:mrow></mml:mfrac></mml:mrow><mml:mo
                                       stretchy="true">)</mml:mo></mml:mrow></mml:mrow><mml:mn>2</mml:mn></mml:msup></mml:mrow></mml:msup></mml:mrow></mml:math>
αsoma(V)=35.715 * e−(V−2350.45)2
<mml:math display="block"><mml:mrow><mml:msub><mml:mi>β</mml:mi><mml:mrow><mml:mtext>soma</mml:mtext></mml:mrow></mml:msub><mml:mrow><mml:mo
                                       stretchy="true">(</mml:mo><mml:mi>V</mml:mi><mml:mo stretchy="true">)</mml:mo></mml:mrow><mml:mo>=</mml:mo><mml:mn>26.79</mml:mn><mml:mo>
                                       * </mml:mo><mml:msup><mml:mi>e</mml:mi><mml:mrow><mml:mo>−</mml:mo><mml:msup><mml:mrow><mml:mrow><mml:mo stretchy="true">(</mml:mo><mml:mrow><mml:mfrac><mml:mrow><mml:mi>V</mml:mi><mml:mo>+</mml:mo><mml:mn>135.1</mml:mn></mml:mrow><mml:mrow><mml:mn>30.32</mml:mn></mml:mrow></mml:mfrac></mml:mrow><mml:mo
                                       stretchy="true">)</mml:mo></mml:mrow></mml:mrow><mml:mn>2</mml:mn></mml:msup></mml:mrow></mml:msup><mml:mo>+</mml:mo><mml:mn>15.95</mml:mn><mml:mo>
                                       * </mml:mo><mml:msup><mml:mi>e</mml:mi><mml:mrow><mml:mo>−</mml:mo><mml:msup><mml:mrow><mml:mrow><mml:mo stretchy="true">(</mml:mo><mml:mrow><mml:mfrac><mml:mrow><mml:mi>V</mml:mi><mml:mo>+</mml:mo><mml:mn>97.09</mml:mn></mml:mrow><mml:mrow><mml:mn>32.35</mml:mn></mml:mrow></mml:mfrac></mml:mrow><mml:mo
                                       stretchy="true">)</mml:mo></mml:mrow></mml:mrow><mml:mn>2</mml:mn></mml:msup></mml:mrow></mml:msup><mml:mo>,</mml:mo></mml:mrow></mml:math>
βsoma(V)=26.79 * e−(V+135.130.32)2+15.95 * e−(V+97.0932.35)2, for the somatic channels, and
<mml:math display="block"><mml:mrow><mml:msub><mml:mi>α</mml:mi><mml:mrow><mml:mtext>axon</mml:mtext></mml:mrow></mml:msub><mml:mrow><mml:mo
                                       stretchy="true">(</mml:mo><mml:mi>V</mml:mi><mml:mo stretchy="true">)</mml:mo></mml:mrow><mml:mo>=</mml:mo><mml:mn>360.18</mml:mn><mml:mo>
                                       * </mml:mo><mml:msup><mml:mi>e</mml:mi><mml:mrow><mml:mo>−</mml:mo><mml:msup><mml:mrow><mml:mrow><mml:mo stretchy="true">(</mml:mo><mml:mrow><mml:mfrac><mml:mrow><mml:mi>V</mml:mi><mml:mo>−</mml:mo><mml:mn>83.73</mml:mn></mml:mrow><mml:mrow><mml:mn>77.36</mml:mn></mml:mrow></mml:mfrac></mml:mrow><mml:mo
                                       stretchy="true">)</mml:mo></mml:mrow></mml:mrow><mml:mn>2</mml:mn></mml:msup></mml:mrow></mml:msup></mml:mrow></mml:math>
αaxon(V)=360.18 * e−(V−83.7377.36)2
<mml:math display="block"><mml:mrow><mml:msub><mml:mi>β</mml:mi><mml:mrow><mml:mtext>axon</mml:mtext></mml:mrow></mml:msub><mml:mrow><mml:mo
                                       stretchy="true">(</mml:mo><mml:mi>V</mml:mi><mml:mo stretchy="true">)</mml:mo></mml:mrow><mml:mo>=</mml:mo><mml:mn>26.94</mml:mn><mml:mo>
                                       * </mml:mo><mml:msup><mml:mi>e</mml:mi><mml:mrow><mml:mo>−</mml:mo><mml:msup><mml:mrow><mml:mrow><mml:mo stretchy="true">(</mml:mo><mml:mrow><mml:mfrac><mml:mrow><mml:mi>V</mml:mi><mml:mo>+</mml:mo><mml:mn>107.1</mml:mn></mml:mrow><mml:mrow><mml:mn>12.03</mml:mn></mml:mrow></mml:mfrac></mml:mrow><mml:mo
                                       stretchy="true">)</mml:mo></mml:mrow></mml:mrow><mml:mn>2</mml:mn></mml:msup></mml:mrow></mml:msup><mml:mo> + </mml:mo><mml:mn>106.78</mml:mn><mml:mo>
                                       * </mml:mo><mml:msup><mml:mi>e</mml:mi><mml:mrow><mml:mo>−</mml:mo><mml:msup><mml:mrow><mml:mrow><mml:mo stretchy="true">(</mml:mo><mml:mrow><mml:mfrac><mml:mrow><mml:mi>V</mml:mi><mml:mo>+</mml:mo><mml:mn>106.6</mml:mn></mml:mrow><mml:mrow><mml:mn>27.22</mml:mn></mml:mrow></mml:mfrac></mml:mrow><mml:mo
                                       stretchy="true">)</mml:mo></mml:mrow></mml:mrow><mml:mn>2</mml:mn></mml:msup></mml:mrow></mml:msup><mml:mo>,</mml:mo></mml:mrow></mml:math>
βaxon(V)=26.94 * e−(V+107.112.03)2 + 106.78 * e−(V+106.627.22)2, for the axonal channels. The INaP was calculated as a product of GNaP and driving force (Vm–ENa), where Vm is the membrane potential and ENa, the Na+ equilibrium potential, was calculated based on constant extracellular Na+ concentration of 151 mmol/l and either constant (4 mmol/l) or variable intracellular Na+ concentration. In some models, the INaP was calculated using the driving force defined by the Goldman–Hodgkin–Katz (GHK) flux equation:
<mml:math display="block"><mml:mrow><mml:msub><mml:mi>I</mml:mi><mml:mi>NaP</mml:mi></mml:msub><mml:mo>=</mml:mo><mml:msub><mml:mi>P</mml:mi><mml:mi>NaP</mml:mi></mml:msub><mml:mfrac><mml:mrow><mml:msub><mml:mi>V</mml:mi><mml:mi
                                       mathvariant="normal">m</mml:mi></mml:msub><mml:msup><mml:mi>F</mml:mi><mml:mn>2</mml:mn></mml:msup></mml:mrow><mml:mrow><mml:mi>R</mml:mi><mml:mi>T</mml:mi></mml:mrow></mml:mfrac><mml:mfrac><mml:mrow><mml:msub><mml:mrow><mml:mo
                                       stretchy="false">[</mml:mo><mml:mtext>Na</mml:mtext><mml:mo stretchy="false">]</mml:mo></mml:mrow><mml:mi>i</mml:mi></mml:msub><mml:mo>−</mml:mo><mml:msub><mml:mrow><mml:mo
                                       stretchy="false">[</mml:mo><mml:mtext>Na</mml:mtext><mml:mo stretchy="false">]</mml:mo></mml:mrow><mml:mi>o</mml:mi></mml:msub><mml:mtext>exp</mml:mtext><mml:mo
                                       stretchy="false">(</mml:mo><mml:mo>−</mml:mo><mml:msub><mml:mi>V</mml:mi><mml:mi mathvariant="normal">m</mml:mi></mml:msub><mml:mi>F</mml:mi><mml:mo>/</mml:mo><mml:mi>R</mml:mi><mml:mi>T</mml:mi><mml:mo
                                       stretchy="false">)</mml:mo></mml:mrow><mml:mrow><mml:mn>1</mml:mn><mml:mo>−</mml:mo><mml:mtext>exp</mml:mtext><mml:mo stretchy="false">(</mml:mo><mml:mo>−</mml:mo><mml:msub><mml:mi>V</mml:mi><mml:mi
                                       mathvariant="normal">m</mml:mi></mml:msub><mml:mi>F</mml:mi><mml:mo>/</mml:mo><mml:mi>R</mml:mi><mml:mi>T</mml:mi><mml:mo
                                       stretchy="false">)</mml:mo></mml:mrow></mml:mfrac><mml:mo>,</mml:mo></mml:mrow></mml:math>
INaP=PNaPVmF2RT[Na]i−[Na]oexp(−VmF/RT)1−exp(−VmF/RT), where PNaP is persistent Na+ permeability of the membrane, R is gas constant, and T is temperature. The channel densities, expressed either as GNaPmax or PNaPmax, were tuned to account for the measured Na+ fluxes in the different neuronal compartments. Single-Na+ channel conductance was assumed to be 18 pS (Fleidervish et al., 1996); the single-Na+ channel permeability of 4.575 * 10−8 m/s was obtained by fitting single-channel currents in a voltage range of −50 to 0 mV (Fleidervish et al., 1996) with the GHK flux equation. The models included no other type of ion channels.
The diffusion of Na+ ions was modeled as the ions exchange between adjacent neuronal compartments using the protocols in NEURON assuming a diffusion coefficient of 0.6 µm2/ms (Kushmerick and Podolsky, 1969; Fleidervish et al., 2010). The resting intracellular and the extracellular Na+ concentrations were set to 4 and 151 mmol/l, respectively.
Results
Voltage ramp-elicited Na+ transients in soma and processes of layer 5 pyramidal neurons
In 136 layer 5 murine pyramidal neurons, we recorded changes in the fluorescence of the Na+-sensitive dye SBFI during slow voltage ramps in the soma and in nearby axon and dendrites. All the fluorescence transients were blocked by bath-applied tetrodotoxin (TTX; 1 µm, n = 22). During experiments, axons were distinguished from the basal dendrites because they emerged from the soma opposite the apical dendrite and had distinctive Na+ transients (Fleidervish et al., 2010; Baranauskas et al., 2013; Katz et al., 2018).
Figure 1A illustrates the TTX-subtracted, whole-cell INaP along with somatic and AIS Na+ transients elicited by slow (35 mV/s) depolarizing voltage ramps from −70 to 0 mV, with K+ and Ca2+ conductances blocked pharmacologically. The rising rate of the ramps was chosen to entirely inactivate even the “slowest” known transient Na+ channels (Cummins et al., 2001) while causing minimal slow inactivation of INaP (Fleidervish and Gutnick, 1996). As in rat pyramidal neurons (Fleidervish et al., 2010), the onset of the electrically recorded INaP occurred simultaneously with the onset of the change in AIS SBFI fluorescence (Fig. 1B), whereas [Na+]i changes in soma and proximal apical dendrite occurred at more depolarized voltages, suggesting a leftward shift in INaP activation kinetics in the axon (Fleidervish et al., 2010).
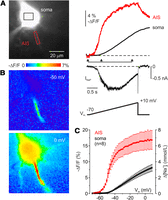
Voltage ramp-elicited whole-cell INaP and Na+ transients in soma and AIS of L5 pyramidal neurons. A, Left, L5 pyramidal neuron filled with SBFI-containing, Cs+-based solution via somatic patch pipette, as seen during the fluorescence imaging experiment with a NeuroCCD-SMQ camera. Right, TTX-subtracted INaP and somatic (black) and axonal (red) ΔF/F transients elicited by 2-s-long voltage ramp from −70 to 0 mV. INaP and axonal [Na+]i both began to rise at the same voltage of approximately −60 mV, whereas the onset of the somatic transient was significantly delayed. During the ramp, at all voltages, the AIS Na+ elevation was significantly larger than in the soma. B, Pseudocolor maps of the ramp elicited ΔF/F changes between the times marked by the arrowheads in A. Top, At −50 mV, Na+ elevation was only detected in the AIS. Bottom, At 0 mV, large Na+ signals were also seen in the soma and dendrites. C, Mean ΔF/F–voltage relationship for soma and AIS of L5 cells. Dots are mean values (n = 8). Δ[Na+]i values were obtained from the ΔF/F values based on intracellular calibration of Na+ sensitivity of SBFI fluorescence.
Analysis of the mean ΔF/F–voltage relationships (Fig. 1C) revealed that in the AIS the ramp-elicited [Na+]i buildup began at −62 ± 1 mV (n = 8) and in the soma at −48 ± 1 mV (n = 8). In the AIS, the Na+ concentration grew rapidly, reaching its half-maximal value of 7.4 mmol/L already at −45 ± 1 mV. In the soma, the [Na+]i grew more gradually, reaching a half-maximal value of 5.6 mmol/L at −18 ± 1 mV. While the observed slower rate of [Na+]i elevation in the soma could reflect a lower influx rate of Na+ ions, it may also be explained, at least partially, by the low surface-to-volume ratio of this compartment. We previously showed that the shapes of the action potential-elicited Na+ transients could be used to deduce the AIS/soma ratio for the transient Na+ conductance (Fleidervish et al., 2010). Using a similar approach to ramp-induced Na+ transients led us to conclude that the GNaP ratio between soma and AIS lies within a 0.3–3 range (Fig. 2).

The shape of ramp-evoked AIS Na+ transients constrains the ratio of GNaP densities in soma and AIS to a 0.3–3 range. Normalized AIS Na+ transients in experiment (left) and in models with different AIS-to-soma ratios of GNaP density. In the model, the soma (length, 23 μm; diameter, 23 μm) gave rise to the 1.2-μm-thick axon. The Na+ transients were acquired from the middle of the 50-µm-long AIS. The horizontal dashed lines are to show the resting [Na+]i level, and the vertical dashed lines are to show the time of ramp end. Somatic GNaP density was kept constant at 5 pS/µm2, and GNaP density in the AIS was varied over the range of zero to threefold of the somatic density (numbers on the top of the figure). The model required the AIS GNaP density to be one-third to threefold the somatic density to match the experimentally determined signals.
Reconstruction of Na+ conductance from SBFI fluorescence transients
Because the active mechanisms for Na+ ion extrusion are relatively slow (Rose and Konnerth, 2001; Fleidervish et al., 2010), the dynamics of the ramp-evoked Na+ transients can be entirely described in terms of influx and diffusion. Thus, with certain precautions, we can use the fluorescence
measurements to estimate the fluxes of Na+ ions into different compartments. Since Na+ ions carry one elementary charge, the experimentally measured mean [Na+]i changes in the soma and AIS (Fig. 3A) and morphometric measurements can be used to calculate the total cumulative charge Na+ transfer density, QNaP, in accordance with the following equation:
<mml:math display="block"><mml:mrow><mml:msub><mml:mi>Q</mml:mi><mml:mrow><mml:mi>N</mml:mi><mml:mi>a</mml:mi><mml:mi>P</mml:mi></mml:mrow></mml:msub><mml:mo>=</mml:mo><mml:mi>k</mml:mi><mml:mo>·</mml:mo><mml:msub><mml:mi>C</mml:mi><mml:mrow><mml:mtext>Faraday</mml:mtext></mml:mrow></mml:msub><mml:mo>·</mml:mo><mml:mfrac><mml:mrow><mml:mi>Δ</mml:mi><mml:mi>F</mml:mi></mml:mrow><mml:mi>F</mml:mi></mml:mfrac><mml:mo>·</mml:mo><mml:mfrac><mml:mrow><mml:mtext>volume</mml:mtext></mml:mrow><mml:mrow><mml:mtext>surface
                                    area</mml:mtext></mml:mrow></mml:mfrac><mml:mo>,</mml:mo></mml:mrow></mml:math>
QNaP=k·CFaraday·ΔFF·volumesurface area, where k is the change that causes ΔF/F = 1% (0.4 mm; Rose et al., 1999), CFaraday is Faraday's constant, ΔF is a change in fluorescence, and F is the resting SBFI fluorescence (corrected for the tissue autofluorescence; see Materials and Methods). The equation assumes
that, in neuronal cytoplasm, there is no Na+ buffering. Indeed, the cytoplasm contains almost no intrinsic Na+ buffering molecules (Kushmerick and Podolsky, 1969), and the buffering of Na+ ions by low-affinity indicator, SBFI, is not significant (Fleidervish et al., 2010). Figure 3B illustrates the calculated QNaP plotted as a function of voltage. The maximal QNaP in the AIS was ∼20% of that in the soma, despite the much higher [Na+]i elevation in the AIS. This seeming discrepancy can be explained by a significantly lower somatic surface-to-volume ratio
that requires much higher Na+ influx to build up an equivalent change in [Na+]i. By differentiation of the Na+ charge transfer traces with respect to time, we obtained mean INaP density–voltage characteristics (Fig. 3C), and then, by dividing the currents by the Nernstian driving force, Vm – ENa, GNaP density–voltage relationships were computed. Interestingly, whereas the shape of the somatic GNaP transform closely followed the Boltzmann function, the AIS GNaP–Vm characteristics had a bell shape, implying that the axonal INaP could be interpreted as a “window current,” as predicted by the Hodgkin–Huxley formalism (Chandler and Meves, 1966, 1970; Attwell et al., 1979).
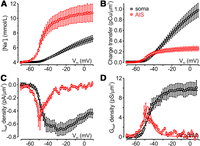
Differences in GNaP properties between soma and axon initial segment. A, Mean [Na+]i elevations in soma (black) and AIS (red) of layer 5 pyramidal cells (n = 8) during 2-s-long voltage ramp from −70 to +10 mV. Here and below, data are plotted as a function of voltage. B, Mean Na+ charge transfer density in soma (black) and AIS (red) derived from the experimentally observed changes in [Na+]i and morphometric data. C, Mean INaP density in soma (black) and AIS (red) obtained by differentiation of the Na+ charge transfer traces with respect to time. D, Mean GNaP density in soma (black) and AIS (red) calculated as INaP density divided by Nernstian electromotive force for Na+ ions, Vm–ENa.
This straightforward interpretation of the AIS Na+ signals, however, does not account for lateral diffusion of Na+ ions from the AIS to the neighboring compartments, which can mask the real magnitude of Na+ influx. We therefore focused on the potential role of lateral diffusion of Na+ ions in the interpretation of Na+ fluorescence signals.
Shape and amplitude of Na+ transients are affected by lateral diffusion of Na+ ions
Since in voltage-clamped neurons, at any given time, there is no substantial voltage gradient in the cytoplasm, the intracellular diffusion of Na+ ions is primarily driven by the concentration gradient. The diffusion will naturally occur from the regions where high Na+ concentration has been built up following the transmembrane Na+ influx, to the regions where the concentration is lower, until equilibrium is reached (Fick, 1855). At its source, the rate of diffusion is influenced by (1) the magnitude of [Na+]i elevation, which by itself reflects the magnitude of transmembrane Na+ influx and the surface-to-volume ratio; (2) the length of the region where [Na+]i is elevated; and (3) the cross-sectional area of the region through which the diffusion occurs. At the sink, in addition to the magnitude of [Na+]i elevation, the volume and length of the region into which the Na+ ions diffuse constrain the diffusion rate over time. Because of the significant length of the AIS, the diffusion-mediated removal of Na+ ions from this compartment is expected to be relatively slow. It is therefore likely that the AIS Na+ transients elicited by faster ramps will be less affected by diffusion. However, our attempts to increase the speed of ramps failed because faster ramps produced INaP with distorted voltage dependence, indicating poor spatial and temporal voltage clamp. Moreover, comparison of the AIS Na+ transients evoked by ramps at different speeds revealed that, at faster ramp velocity, the resulting INaP was significantly contaminated by transient current (Cummins et al., 2001), whereas at slower ramps the INaP amplitude declined as a result of slow inactivation (Fleidervish and Gutnick, 1996).
In layer 5 pyramidal neurons, the AIS Na+ transients are influenced by lateral diffusion of Na+ ions that flow in two opposite directions: to the soma and to the first myelinated internode. To gain a more quantitative understanding of factors that determine the diffusion rate, we next studied ramp-elicited [Na+]i changes in compartmental models based on morphologic parameters of layer 5 pyramidal cells determined by two-photon microscopy. To detect the AIS and internodal boundaries, experiments were performed in brain slices from transgenic mice expressing membrane-targeted EGFP in mature oligodendrocytes under control of PLP1 promoter (Hill et al., 2014). Live cortical slices were examined under the two-photon microscope and 12–22 optical sections were taken at 1 µm intervals through parts of 12 layer 5 pyramidal neurons filled with SBFI, at a wavelength of 760 nm, and through adjacent oligodendrocytes and their processes, at 940 nm. The most proximal spot at which colocalization of the SBFI and EGFP fluorescence was detected was taken as a distal AIS boundary (Fig. 4). The SBFI and EGFP fluorescence colocalized over the entire first internodal length. Only the SBFI fluorescence was detected at the presumed node of Ranvier, an ∼1-µm-long segment of the axonal trunk from which thin collateral axonal branches usually originated.
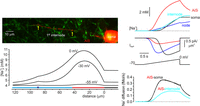
Model, based on two-photon morphometric measurements in a representative layer 5 neuron predicts diffusion rates of Na+ ions from the AIS to the soma and to the internode during the voltage ramp. Left, Top, Structural relationship between the axon of layer 5 pyramidal cell and the myelinating processes of oligodendrocytes. The image obtained by merging optical sections at a wavelength of 760 and 940 nm; yellow color indicates the colocalization of the SBFI (red) and EGFP (green) fluorescence, revealing the boundaries of the first myelinated internode (yellow arrows). Left, Bottom, Simulated changes in [Na+]i elicited by voltage ramp to indicated voltages, plotted against distance from the soma. Voltage protocol, current traces, and [Na+]i in soma (black), AIS (red), internode (cyan), and node of Ranvier (blue) are shown in right top panel. Right, Bottom, Model predicted the rate of Na+ diffusion from the AIS to the soma (black) and to the internode (cyan), plotted as a function of time.
In the models, the somatic and AIS INaP densities were adjusted to match the experimentally observed mean Na+ elevations, the density at the node of Ranvier was twice the AIS density based on our previous observation on the node–AIS difference in rat Na+ channel density (Fleidervish et al., 2010), and the myelinated internode contained no Na+ channels. The voltage dependence of axonal GNaP was shifted by −10 mV compared with somatodendritic GNaP. The model predicted that, during the voltage ramp, the first myelinated internode is being filled gradually with Na+ ions diffusing from the AIS, whereas the nodal Na+ influx plays little role in internodal [Na+]i elevation. The Na+ concentration plotted as a function of distance from the soma for three different times during the ramp reached its maximum at progressively more distal locations, reflecting a higher diffusion rate toward the soma than to the internode. During the ramp, the rate of Na+ diffusion from the AIS to the soma rose sharply, reaching a maximum of 0.35 fmol/s at a voltage of −35 mV and then declined, reflecting a reduction in AIS–soma gradient because of local somatic Na+ influx. The rate of Na+ diffusion from the AIS to the internode increased more gradually, reaching a nearly steady maximal value of 0.17 fmol/s at voltage of −25 mV.
We next tested the model prediction in eight neurons in which both ramp-evoked SBFI fluorescence changes and morphometric parameters were measured. In a representative neuron with an AIS length of 36 µm (Fig. 5A), fast-rising Na+ transients elicited by brief depolarizing voltage steps were prominent only within the AIS boundaries (Fleidervish et al., 2010), whereas no Na+ influx was detected in the myelinated segment (Fig. 5B). Interestingly, while the Na+ signal amplitude became smaller as a function of distance from the soma (Baranauskas et al., 2013), the detectable fast-rising Na+ signals were consistently observed up to the proximal edge of the segment ensheathed by myelinating oligodendrocyte process. During the ramp, Na+ elevation first became detectable in the AIS at a voltage of approximately −55 mV. In the myelinated segment, the [Na+]i growth was slower and the amplitude of Na+ elevation was smaller than in the AIS. Upon the ramp termination, the AIS [Na+]i decayed rapidly, whereas in the internode it continued to grow for some time, reflecting longitudinal Na+ diffusion from the AIS. Comparison of the experimentally observed fluorescence changes with the [Na+]i changes predicted by the model, for the time of the brief voltage step and for three different times during the voltage ramp (Fig. 5C), revealed striking similarity, indicating that the ramp-evoked Na+ signals were completely predicted by the diffusional model.

Ramp-evoked axonal Na+ signals reflect the influx of Na+ ions into the AIS and their lateral diffusion to the soma and first myelinated internode. A, Structural relationship between the axon of layer 5 pyramidal cell and the myelinating processes of oligodendrocytes. Left, Single two-photon optical section through part of a layer 5 pyramidal neuron filled with SBFI (red) obtained at a wavelength of 760 nm. Middle, The same optical section containing cell bodies and processes of oligodendrocytes expressing membrane-targeted EGFP (green) obtained at a wavelength of 940 nm. Right, Merged image; yellow color indicates colocalization of the SBFI and EGFP fluorescence, revealing the AIS boundaries (white line and arrows). B, The same neuron as seen during the fluorescence imaging experiment with a NeuroCCD-SMQ camera. The rectangles indicate the regions within the apical dendrite (blue), soma (black), and AIS 1–3 and myelinated internode 4 (red), from which fluorescence measurements were obtained. AIS boundaries (white line and arrows) detected as described above. Fast-rising Na+ transients elicited by a 20-ms-long voltage step from −70 to 0 mV (a) were prominent only in the proximal and middle AISs (locations 1 and 2); much smaller transients were observed in the distal AIS (3), whereas no Na+ influx was detected in the internode (4). Voltage ramp-evoked Na+ elevations first became detectable within the AIS (1–3) at a voltage of −55 mV (b), whereas a rise in [Na+]i in soma, apical dendrite, and axonal internode (4) became evident at more depolarized voltages (c and d). C, During the voltage ramp, Na+ diffuses from the AIS to the first myelinated internode. Top, Pseudocolor maps of the fluorescence changes between the baseline and times a–d in B. Bottom, Simulated changes in [Na+]i elicited by the same voltage protocol as in B, plotted against distance from the soma. The AIS was assumed to be 36 μm long. Black continuous lines are [Na+]i values at times a–d. Dashed lines are [Na+]i changes in a model with no Na+ diffusion.
Quantitative evaluation of the ramp-evoked Na+ influx in different compartments
Our results suggest that lateral diffusion of Na+ ions has a negligible effect on ramp-elicited somatic Na+ elevations, whereas its influence on the AIS Na+ signals is much more significant. Thus, at any voltage, the AIS [Na+]i represents a product of transmembrane Na+ influx and diffusion-mediated Na+ outflow, which progressively accelerates, reflecting the cumulative buildup of the axonal Na+ concentration. The experimentally observed lack of change in AIS [Na+]i at depolarizing voltages cannot therefore be interpreted as a lack of influx, but as a tight balance between the influx and diffusion-mediated outflow (Fig. 6A). To evaluate the influx and diffusion rates separately, we exploited the difference in their temporal dynamics. Because of their rapid deactivation kinetics (Engel and Jonas, 2005; Park et al., 2013), Na+ channels underlying the persistent Na+ influx are closed almost instantly by switching to negative membrane potentials. The experiments described above, along with the results of compartmental modeling, revealed that dissipation of the Na+ gradient between the AIS and neighboring compartments occurs at a much slower timescale than the switchoff of INaP. The slope of [Na+]i rise, obtained by a linear fit of a 140-ms-long segment of fluorescence trace just before ramp termination at −30 mV (black line), was taken as a measure of the sum of rates of Na+ entry and removal. The slope of [Na+]i decay obtained by a linear fit of a 140-ms-long segment of fluorescence trace, starting from the time of ramp termination (Fig. 6A, green line), was taken as a measure of the rate of Na+ removal. The difference between the two slopes was used to obtain a quantitative estimate of the rate of Na+ influx at a voltage when the ramp was terminated. The length of segments was chosen for them to be sufficiently long to allow accurate slope measurement, while still be short enough to justify assumptions of them representing a constant voltage (with accuracy of ∼5 mV) and linear [Na+]i change. Figure 6B illustrates a representative recording of INaP and ΔF/F changes in response to voltage ramps (35 mV/s) to the specified voltages from a holding potential of −70 mV. The rates of rise and decay of the axonal ΔF/F signals at ramp termination were measured as described above. In the AIS, the rate of Na+ elevation was maximal at voltages near −40 mV; it declined steeply, approaching zero value at voltages above −10 mV. The rate of Na+ decay, however, reached its maximal value at −20 mV. It declined slightly at more positive voltages, probably reflecting a reduction in axosomatic Na+ gradient because of the somatic influx of Na+ ions. The mean rates of ΔF/F changes before and after the ramp end obtained from eight pyramidal neurons (Fig. 6C) were used to calculate the mean diffusion-corrected rate of axonal Na+ influx as a function of voltage.

Point-by-point evaluation of Na+ influx to the AIS at different membrane potentials. A, Quantitative separation of Na+ influx and lateral diffusion. Whole-cell current and ΔF/F changes in soma (black) and AIS (red) during the voltage ramp from −70 to −30 mV at ramp speed of 35 mV/s. Note that during the ramp, the AIS [Na+]i is a product of INaP-associated Na+ influx and diffusion-mediated outflow of Na+ ions (cyan and green arrows, respectively). After the return to holding potential of −70 mV, INaP rapidly deactivates and the AIS [Na+]i changes reflect diffusion only. Dashed lines represent linear fits of 70 ΔF/F data points before (black) and after ramp end (green), used to determine the rate of [Na+]i rise and the rate of [Na+]i decay, respectively. B, Representative recording of whole-cell current and ΔF/F changes in soma (black) and AIS (red) elicited by ramps (35 mV/s) to the specified voltages from a holding potential of −70 mV. Vertical dashed lines mark the end of the ramp. C, Mean rates of the AIS ΔF/F change before (black) and after ramp end (green; mean ± SE, n = 8) at different membrane potentials. Cyan dots were obtained by subtracting the rate of the ΔF/F decay after the ramp end (diffusion) from the rate of the ΔF/F increase during the 140 ms before the ramp end (influx + diffusion). The diffusion-corrected rates of ΔF/F change were further used to calculate the AIS Na+ influx for a given voltage (see Results).
Contribution of axonal and somatic channels to whole-cell INaP
While the changes in somatic fluorescence could be used directly to yield the somatic INaP density, the current density–voltage characteristics for axonal persistent Na+ conductance were obtained by the multiplication of diffusion-corrected rates of axonal Na+ influx at each voltage by one-quarter of the axonal diameter and Faraday's constant (Fig. 7A). The somatic I–V curve peaked at a voltage of −25 mV, whereas the peak of the AIS I–V characteristics was at −40 mV; the peak density of INaP in two compartments was not significantly different (p = 0.51). For eight neurons, both somatic and AIS GNaP–voltage curves followed a Boltzmann pattern with half-activation at −42 and −52 mV, and maximal conductance of 11 ± 3 and
6 ± 1 pS/µm2, respectively (Fig. 7B). The maximal conductance values were derived from the calculated NPo density, where N is the number of channels in noninactivating gating mode per 1 µm2 and Po is their open probability, assuming single-channel conductance of 18 pS (Fleidervish et al., 1996). The maximal NPo densities for noninactivating Na+ channels were ∼0.6/µm2 for soma and ∼0.3/µm2 AIS. The density of channels responsible for INaP generation, N, was ∼0.92 and 0.46 channels per 1 µm2 for soma and AIS, respectively, assuming that the maximal open probability of Na+ channel during the sustained bursts of openings is ∼0.65 (Fleidervish et al., 2008). To estimate the relative contribution of the AIS and soma to whole-cell INaP, we calculated the current generated in each of these compartments as <mml:math display="inline"><mml:mrow><mml:msub><mml:mi>I</mml:mi><mml:mrow><mml:mtext>NaP</mml:mtext></mml:mrow></mml:msub><mml:mrow><mml:mo
stretchy="true">(</mml:mo><mml:mi>V</mml:mi><mml:mo stretchy="true">)</mml:mo></mml:mrow><mml:mo>=</mml:mo><mml:mi>N</mml:mi><mml:mo>·</mml:mo><mml:mtext>Po</mml:mtext><mml:mrow><mml:mo
stretchy="true">(</mml:mo><mml:mi>V</mml:mi><mml:mo stretchy="true">)</mml:mo></mml:mrow><mml:mo>·</mml:mo><mml:mi>i</mml:mi><mml:mrow><mml:mo
stretchy="true">(</mml:mo><mml:mi>V</mml:mi><mml:mo stretchy="true">)</mml:mo></mml:mrow><mml:mo>·</mml:mo><mml:mi>A</mml:mi></mml:mrow></mml:math>INaP(V)=N·Po(V)·i(V)·A, where N is the number of persistent Na+ channels in 1 µm2 of the membrane, Po(V) is channel open probability, i(V) is single-channel current calculated using GHK flux equation and A is surface area. By assuming that the axons are cylinders and the somata are spheres, from the measured somatic diameters
and AIS diameters and lengths we calculated the mean somatic and AIS surface area of ∼706 and ∼57 µm2, respectively. Our calculations of INaP amplitude suggest that most of the whole-cell INaP originates at the soma, whereas at functionally critical subthreshold voltages most of the INaP is generated in the AIS (Fig. 7C).

Persistent Na+ conductance in soma and AIS behaves as a Boltzmann function of the voltage. A, Mean INaP density in soma (black) and AIS (red) obtained by time-based differentiation of the Na+ charge transfer traces with respect to time for soma (n = 8), and by digital subtraction of the rates of diffusional Na+ outflow from the influx rates measured in AIS (n = 12). B, Persistent Na+ conductance density in soma (black) and AIS (red) as a function of voltage. Continuous lines are the best fits by a Boltzmann equation (V1/2 = −42 and −52 mV for soma and AIS, respectively). C, Somatic (black) and AIS (red) contribution for total (blue) persistent sodium current in response to voltage ramp from −70 to +10 mV. Currents are calculated based on INaP density and surface area of the compartments.
Time-dependent changes in amplitude of INaP and associated Na+ fluxes
The above findings indicate that the amplitude of the noninactivating component of Na+ conductance in the soma dramatically exceeds expectations derived from the single-Na+ channel recordings (Astman et al., 2006). Indeed, the mean AIS GNaP density, 6 pS/µm2, constitutes 0.1–0.75% of the total Na+ conductance (Kole et al., 2008; Fleidervish et al., 2010), whereas the mean somatic GNaP density, 11 pS/µm2, constitutes 2–24% of the total Na+ conductance (Stuart and Sakmann, 1994; Hallermann et al., 2012). We therefore sought to find out whether, in low-access resistance whole-cell recordings such as those used in these experiments, dialysis of the cytoplasm might artificially increase the propensity of Na+ channels to generate INaP. In the whole-cell experiment illustrated in Figure 8A, ramp-evoked INaP and local Na+ elevations in soma and axon were continuously monitored from the second to the tenth minute after the break-in to the cell. In this cell, the INaP amplitude measured at −35 mV (voltage at which INaP is almost not contaminated by incompletely blocked K+ current; Astman et al., 2006), increased from −536 to −1437 pA over the 8 min period, whereas the ΔF/F at 0 mV increased from 7.5% to 16.2% at the soma and from 9.8% to 23.9% in the AIS. The increased whole-cell INaP amplitude does not necessarily reflect an increase in local INaP density, as it also may, at least partially, be explained by improvement of the spatial extent of voltage clamp because of the continuous Cs+ diffusion into the cell (Fleidervish and Libman, 2008). The increased amplitude of ramp-evoked Na+ transients, however, could only be interpreted as an increase in local INaP generation over the recording time. A similar increase in the amplitude of Na+ transients was observed in the soma, AIS, and proximal apical dendrite (Fig. 8B). Which factor contributes to the increase in INaP remains unclear. We previously showed that one of the candidates is endogenous polyamines that are present in neuronal cytoplasm and are capable of constraining the availability of INaP (Fleidervish et al., 2008). To test whether preventing endogenous polyamine dialysis could prevent the time-dependent increase in INaP, we performed whole-cell recordings with spermine added to the pipette solution. All current amplitude measurements were obtained at −35 mV to minimize the INaP contamination by incompletely blocked delayed rectifying K+ current (Astman et al., 2006; Revah et al., 2015). In whole-cell recoding with spermine (2 mm) containing pipette (Fig. 8C), an increase in INaP amplitude measured at −35 mV was less significant (−358 vs −495 pA at the second and tenth minute of recording, respectively), whereas the amplitude of Na+ transients decreased at the soma from 3.4% to 1.8%, and in the AIS from 7.0% to 4.7%. The decrease in ΔF/F amplitude was evident in soma, AIS, and proximal apical dendrite (Fig. 8D), in accordance with the expected rate of spermine diffusion from the whole-cell pipette into the cytoplasm (Fleidervish et al., 2008; Fu et al., 2012). In neurons recorded either with spermine-free pipettes (n = 7) or with pipettes containing spermine at a concentration of 1 mm (n = 6) or 2 mm (n = 6), the presence of spermine had only a minimal effect on the INaP amplitude at the second minute after the break-in (Fig. 8E). Eight minutes later, however, the INaP amplitude grew by 3.25 ± 0.25 times in recordings with a spermine-free pipette, and by 2.31 ± 0.20 times with a pipette containing 1 mm spermine, and it did not change significantly in recordings with 2 mm spermine (0.99 ± 0.11 times). During this time period, the amplitude of the somatic Na+ transients changed 1.69 ± 0.10 times, 1.18 ± 0.25 times, and 0.91 ± 0.25 times in recordings with no spermine, and 1 and 2 mm spermine, respectively (Fig. 8F). The amplitude of the AIS Na+ transients underwent the following similar time-dependent changes: 2.15 ± 0.20, 1.32 ± 0.23, and 1.10 ± 0.24 times with 0, 1, and 2 mm spermine-containing pipette (Fig. 8G). The observed changes in ΔF/F were not because of unsteady dye concentration, since the resting somatic and AIS fluorescence was relatively constant during the recording period. These results suggest that the endogenous polyamines might constrain, to a similar extent, the propensity of both somatic and axonal Na+ channels to generate INaP.

Whole-cell recording causes a time-dependent increase in the amplitude of ramp-evoked currents and Na+ transients, which is reduced by spermine. A, Whole-cell ramp-evoked current and Na+ elevations in soma (black) and AIS (red) at 2 and 10 min after break-in to the cell. Notice that the amplitude of both INaP and of Na+ transients increased as a function of recording time. B, Pseudocolor maps of the ramp elicited ΔF/F changes between the times marked by the arrowheads in A at the second and tenth minute after the break-in. C, In whole-cell recording with exogenous spermine (2 mm) in the pipette, the amplitude of ramp-evoked INaP and of Na+ transients remained relatively stable during the 10 min period after the break-in. D, Pseudocolor maps of the ramp elicited ΔF/F changes between the times marked by the arrowheads in C at the second and tenth minute after the break-in with spermine-containing pipette. E, Averaged (n = 8) INaP amplitudes at −35 mV as a function of time after break-in with pipettes containing control (black squares), 1 mm (open squares), and 2 mm spermine (open circles). F, Averaged (n = 8) peak amplitudes of the somatic ΔF/F transients as a function of time after break-in with a control or spermine-containing pipette. G, Averaged (n = 8) peak amplitudes of the AIS ΔF/F transients as a function of time after break-in with a pipette containing control or spermine.
Discussion
Na+ imaging, in combination with whole-cell electrical recordings, allowed us to evaluate properties of the persistent Na+ conductance in soma and processes of cortical pyramidal neurons. Studying the characteristics of Na+ fluxes elicited by slow voltage ramps revealed that in all neuronal compartments the relationship between conductance and membrane voltage has a Boltzmann function shape, rather than the bell shape that would be measured were the INaP a window current. Although our evidence indicates that the mean density of Na+ channels responsible for INaP generation in the AIS is somewhat lower than in soma and in the proximal apical dendrite, their leftward-shifted voltage dependence in the proximal axon explains why INaP at functionally critical, subthreshold voltages is predominately axonal in origin (Stuart and Sakmann, 1995; Astman et al., 2006; Fleidervish et al., 2010). Finally, our results indicate that INaP availability in all compartments is constrained by the presence of endogenous polyamines.
Our conclusions are based on measurement of local [Na+]i elevations elicited by slow voltage ramps in the soma and processes of pyramidal neurons. Sodium ions are not buffered in cytosol (Kushmerick and Podolsky, 1969; Fleidervish et al., 2010). Therefore, the high-speed imaging approach could provide an accurate and quantitative estimate of INaP density in each compartment with amplitude and time resolution that closely resemble electrical recording. Indeed, since the channels responsible for INaP are highly selective for sodium, and each Na+ ion carries a single elementary charge, the rate of change in fluorescence of the Na+-selective dye is directly proportional to the electrical current flow. This relationship allows us to directly compare INaP in different regions of the cell, once differences in surface-to-volume ratio and lateral diffusion of Na+ ions have been taken into account.
Density and voltage dependence of INaP in different neuronal compartments
We found that GNaP density is similar in proximal apical dendrites, soma, and AIS of pyramidal neurons. However, because channel density is different in these different compartments (Magee and Johnston, 1995; Colbert and Pan, 2002; Kole et al., 2008; Hu et al., 2009; Fleidervish et al., 2010; Lorincz and Nusser, 2010), this similarity does not mean that the propensity of the channels to generate INaP is the same everywhere. Indeed, the fraction of the total number of noninactivating channels in somatic membrane varies greatly (from ∼27% to ∼2%) depending on whether one uses the low, 40 pS/µm2 value for total Na+ channel density (Stuart and Sakmann, 1994) or the high, 500 pS/µm2 value (Hallermann et al., 2012). The fraction of channels responsible for INaP generation in the AIS is ∼0.75%, assuming a uniform channel density of 800 pS/µm2 (Fleidervish et al., 2010). The fraction could vary over the AIS length, reflecting the spatial differences in channel density (Baranauskas et al., 2013) and the spatial segregation of the channel subtypes (Hu et al., 2009). Thus, Nav1.6 channels localized in the distal AIS and nodes of Ranvier produce more persistent current than other channel isoforms (Mantegazza et al., 2005; Rush et al., 2005; Katz et al., 2018), probably because they enter the noninactivating gating mode more frequently (Chatelier et al., 2010). The resolution of our optical recordings is not sufficient to reveal these differences, because rapid lateral diffusion of Na+ ions distorts differences in ion concentrations over short distances.
The results of our measurements of Na+ influx are sensitive to differences in surface-to-volume ratio in the various neuronal compartments. While the error in estimation of surface area of the large somatic compartment is relatively small, it might be larger in the case of thin neuronal processes, whose caliber approaches that of optical resolution (0.3–0.6 µm, depending on fluorescent indicator). Also, we probably overestimated the relevant intracellular volume, since ∼20% of the cell interior is occupied by mitochondria (Santuy et al., 2018) and other Na+-impermeable intracellular organelles. However, the resulting overestimation of the Na+ influx would not be >20%.
Mechanisms of INaP generation
Several different mechanisms have been offered to explain INaP. First, is a “window” current, as predicted by the Hodgkin-Huxley model, in which a noninactivating component of the Na+ current results from the crossover of the steady-state activation and inactivation curves as they asymptotically approach the voltage axis (Hodgkin and Huxley, 1952). The window current has been observed experimentally in a variety of preparations at voltages where both steady-state activation and inactivation values are significantly greater than zero (Chandler and Meves, 1966, 1970; Attwell et al., 1979). However, the more recent studies argue against the “window” current hypothesis by showing that inactivation derives its voltage dependence from the same gating charge movements driving activation, rather than being independent processes, as in the Hodgkin–Huxley model (Aldrich et al., 1983). Moreover, the window is too narrow to account for experimentally observed INaP (French et al., 1990). Second is the steady-state current predicted by the allosteric gating model that accounts for the observation that inactivation is never complete and that it is loosely coupled to activation (Kuo and Bean, 1994; Taddese and Bean, 2002; Milescu et al., 2010). This mechanism is based on known structural and functional features of the Na+ channel, and it predicts a current that closely resembles the experimentally measured INaP. Third is “modal gating” of Na+ channels. In single-channel recordings, individual Na+ channels can switch slowly between different gating modes (Patlak and Ortiz, 1985; Nilius, 1988; Alzheimer et al., 1993), and rare periodic failure of inactivation as channels enter a noninactivating gating mode has been proposed as a mechanism underlying INaP generation. Fourth is brief escapes from inactivation that underlie single late openings and minibursts (Patlak and Ortiz, 1985; Alzheimer et al., 1993) and may contribute to whole-cell INaP. Fifth, a different, as yet unknown, channel (Vega-Saenz de Miera et al., 1997; Kay et al., 1998; Magistretti et al., 1999) might be, at least partly, responsible for INaP generation. The voltage dependence of the reconstructed INaP in all neuronal compartments deviates from that predicted by the Hodgkin–Huxley model-based window current hypothesis. Our data neither support nor argue against the other possible mechanisms for INaP generation listed above.
Polyamines and INaP generation
Our experiments indicate that in whole-cell recordings most of the observed INaP originates in the soma and proximal apical dendrite. This seems to conflict with our previous single-channel study in these neurons (Astman et al., 2006), as we encountered surprisingly few late openings in cell-attached patch recordings of somatic and dendritic Na+ channels in nondialyzed cortical pyramidal cells in brain slices. We postulate that, in nondialyzed neurons, there exist soluble factors that normally prevent late Na+ channel openings, and that removal of these endogenous factors by intracellular dialysis via the low-resistance whole-cell pipette artificially enhances INaP generation. We previously showed that intracellular polyamines might well be such a dialyzable factor (Fleidervish et al., 2008). Spermine, spermidine, and putrescine are present in all eukaryotic cells (Pegg, 2016), and they are known to profoundly affect gating of a variety of ion channels (for review, see Williams, 1997; including several types of Na+ channels (Huang and Moczydlowski, 2001; Fleidervish et al., 2008; Fu et al., 2012). The spermine block of Na+ channels is activity dependent, making it especially effective at curtailing INaP by potently blocking channels in a noninactivating gating mode. Consistent with this hypothesis, we observed a dramatic increase in the amplitude of whole-cell INaP as a function of recording time (Fig. 8). In addition to the higher probability of late openings by individual Na+ channels, this might also reflect improvement of space clamp as cesium is continuously dialyzed into the cell. Na+ imaging revealed that intracellular dialysis causes a time-dependent increase in INaP in all neuronal compartments. When the pipette solution contained spermine, the time-dependent changes in imaged Na+ flux as well as the electrically recorded increase in INaP were greatly diminished. This is in agreement with experiments in culture showing that recombinant Nav1.2 channels in cells dialyzed with polyamine-free intracellular solution produce a gradual increase in Na+ current (Fu et al., 2012), which is prevented when the pipette solution included spermine or spermidine. Fu et al. (2012) compared with the polyamine sensitivity of several Na+ channel subtypes. Unfortunately, they did not directly compare the two main channel subtypes expressed in pyramidal neurons, Nav1.2 and Nav1.6. Our own data do suggest that intracellular dialysis is less effective in the distal part of the AIS, which is largely populated by Nav1.6 channels (Hu et al., 2009), compared with proximal AIS, soma, and dendrites, where Nav1.2 predominates. However, this evidence of subtype specificity must be considered inconclusive in light of the difficulties in spatial resolution. In the brain, the endogenous polyamine levels are tightly controlled (Pegg, 2016). Our data suggest that dysregulation of polyamine pathways in disease may profoundly affect INaP and neuronal excitability, and may play a role in epileptogenesis.
Footnotes
- Received November 26, 2020.
- Revision received April 19, 2021.
- Accepted May 27, 2021.
-
This research was supported by The Israel Science Foundation (Grant 1384/19). We thank Drs. M.J. Gutnick (Hebrew University) and W.N. Ross (New York Medical College) for critically reading the manuscript.
-
The authors declare no competing financial interests.
- Correspondence should be addressed to Ilya A. Fleidervish at ilya{at}bgu.ac.il or Israel Melamed at melamedi{at}bgu.ac.il
- Copyright © 2021 the authors




