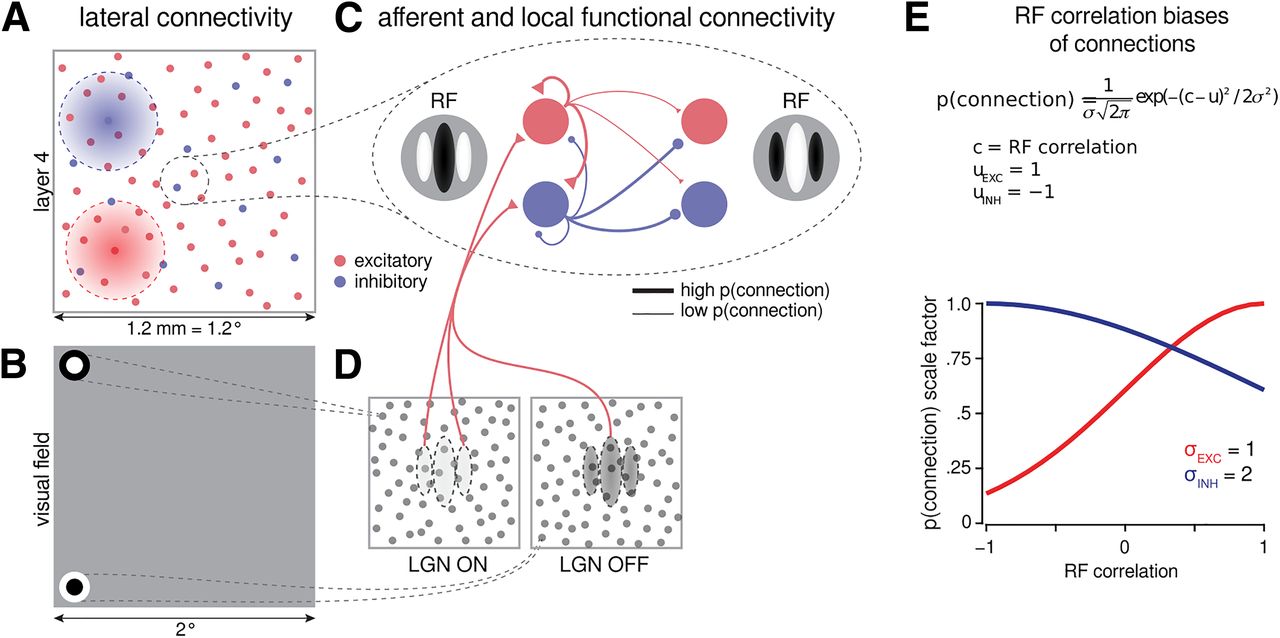
Schematic of LGN-V1 model architecture. A, Cortical lateral connectivity. Functional specificity of local connections is not shown, and connection ranges are not to scale. B, Extent of modeled visual field and example of RFs of one ON- and one OFF-center LGN relay neuron. The model is retinotopically organized, and the extent of the modeled visual field is larger than the corresponding visuotopic area of modeled cortex to prevent clipping of LGN RFs. C, Local connectivity cortex follows a biased push–pull organization; excitatory connections are biased toward correlated RFs, whereas inhibitory connections are mildly biased toward anticorrelated RFs (E). D, Afferent RFs of cortical neurons are formed by sampling synapses from a probability distribution defined by a Gabor function overlaid on the ON and OFF LGN sheets, where positive parts of the Gabor function are overlaid on ON and negative on OFF sheets. The ON regions of RFs are indicated by the white color, and OFF regions by black. E, Connection bias factor as a function of RF correlation between presynaptic and postsynaptic cells. Excitatory cells (red) are much more likely to connect to other cells with similar RFs, and inhibitory cells (blue) are slightly more likely to connect to other cells with anticorrelated RFs (Monier et al., 2003, their Fig. 6). Later, we explore a parameter space of excitatory and inhibitory connection specificity by varying these values of σEXC and σINH.


