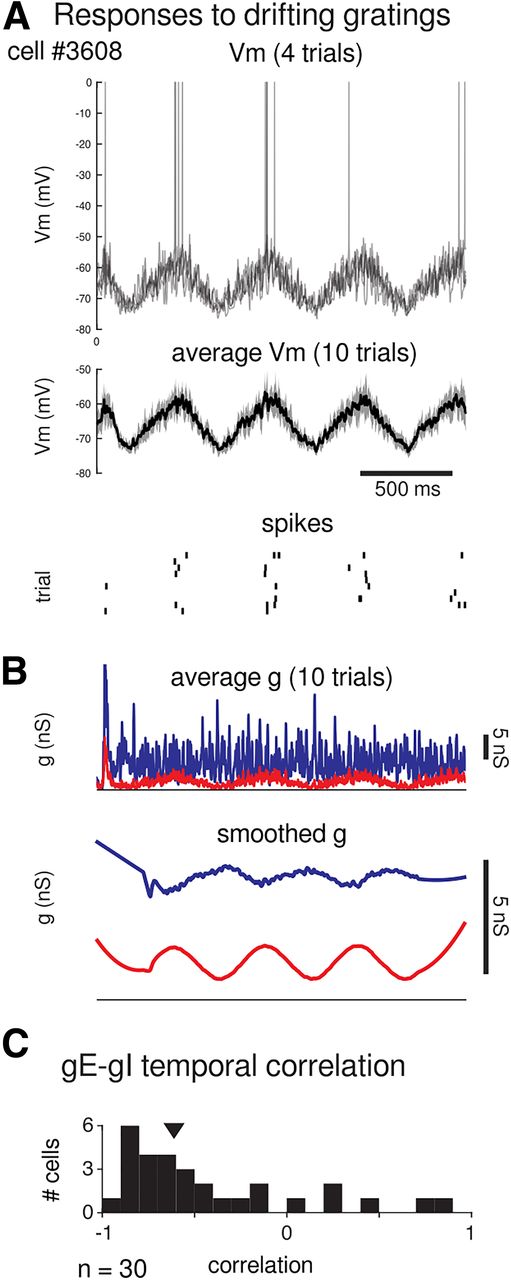
Model neurons responses to drifting gratings. A, Vm and spiking responses over time from an example cell (same cell as in Figure 3) to drifting gratings at its preferred orientation (top, single trials; middle, average without spikes ±SD; bottom, spike rasters from 10 trials). B, The conductance responses from the same cell over time to the same grating. Top, Average gE (red) and gI (blue) from 10 trials. Bottom, Smoothed conductances (see above, Materials and Methods) clearly illustrate a negative temporal correlation (correlation coefficient = −0.74) between gE and gI. C, Histogram of temporal correlations from n = 30 cells from the simulation. As in the example cell, the majority of cells show temporal anticorrelation between gE and gI to the drifting grating. Arrowhead indicates the median correlation from this distribution.


