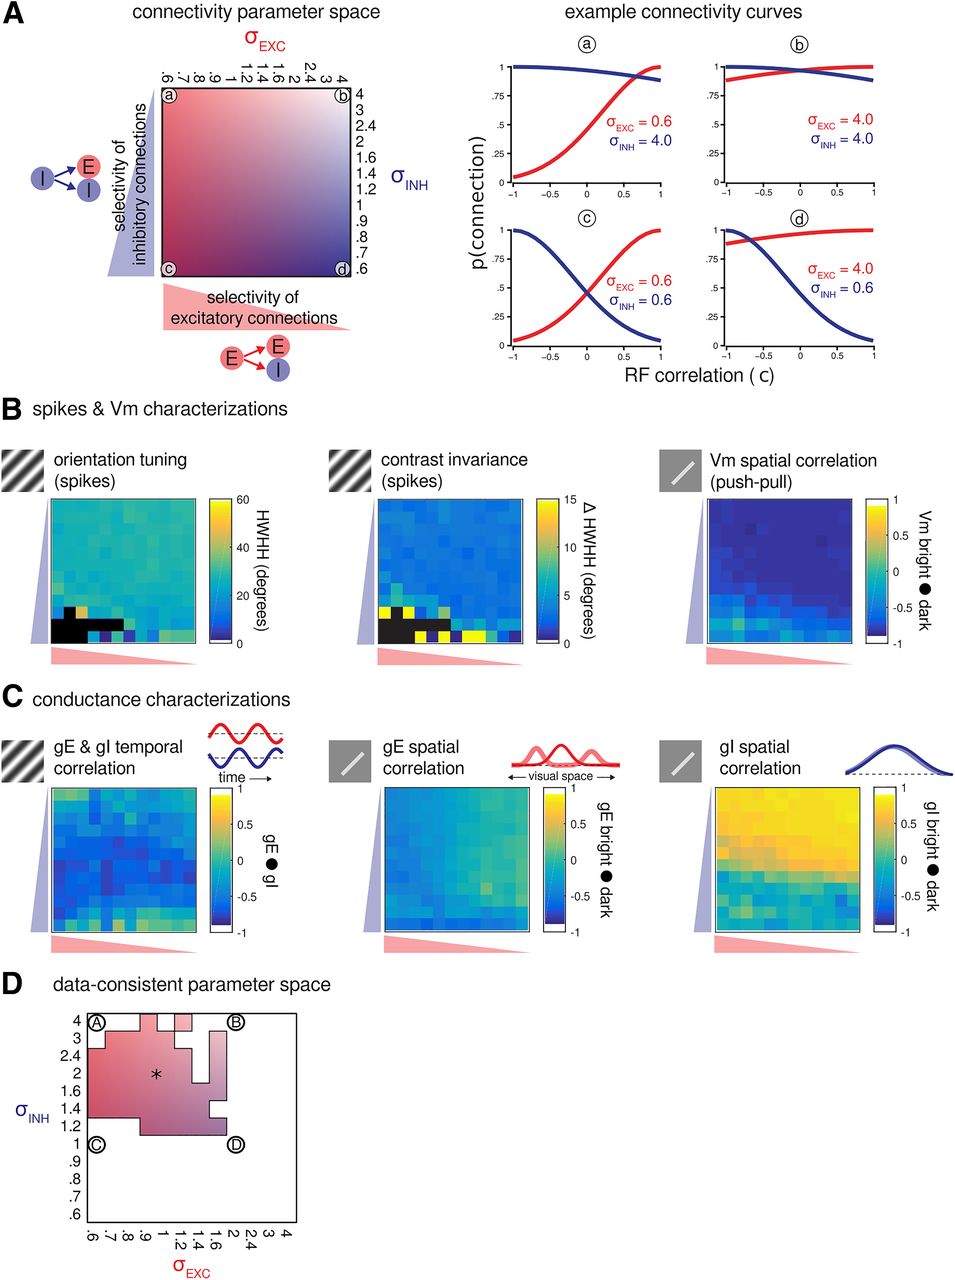
Spiking, Vm, and conductance characterizations across a parameter space of intracortical connectivity schemes. A, Illustration of the parameter space explored in this figure. The sigmoidal function parameters σE (for excitatory connections) and σI (for inhibitory connections) were varied independently between 0.6 (highly selective) and 4 (virtually unselective) values. Throughout this figure, selectivity of excitatory connections grows to the left (of the x-axis) and that of inhibitory connections grows to the bottom (of the y-axis) of each matrix. Right, RF correlation-based connectivity curves for the four extreme combinations (corners of parameter space, a–d; Figure 2). B, Variation of spiking and Vm characteristics across explored parameter space. Left, The median HWHH (degrees) of the spiking responses to high-contrast drifting gratings at varying orientations. Center, The median change in HWHH between the tuning curves in response to gratings at high versus low contrast. Right, The median spatial correlation of Vm responses to bright versus dark bars (as in Fig. 4) at the preferred orientation of the cells. Aside from the lower/lower-left region of parameter space (corresponding with highly selective inhibitory connectivity), these metrics did not vary substantially across the connectivity parameter space. Black squares indicate parametrizations where orientation tuning could not be well fit with Gaussian curve. C, Variation of conductance characteristics across explored parameter space. Left, The median temporal correlation of gE and gI in response to high-contrast drifting gratings at the preferred orientation of the cells as in Figure 5C. Center, The median spatial correlation of gE responses to bright versus dark bars flashed in different locations across each cell's RF as in Figure 4. Right, The median spatial correlation of gI responses to bright versus dark bars flashed in different locations across each cell's RF as in Figure 4. D, Illustration of the region of parameter space that yields simulations with values of spiking, Vm, and conductance response characteristics that are consistent with experimental findings. This region of parameter space corresponds with relatively selective excitatory connections (0.6 < σE < 2.0) and much less selective inhibitory connections (σI > 1.2). Note that the simulation illustrated in Figures 4 and 5 is shown within this parameter space with an asterisk (*).


