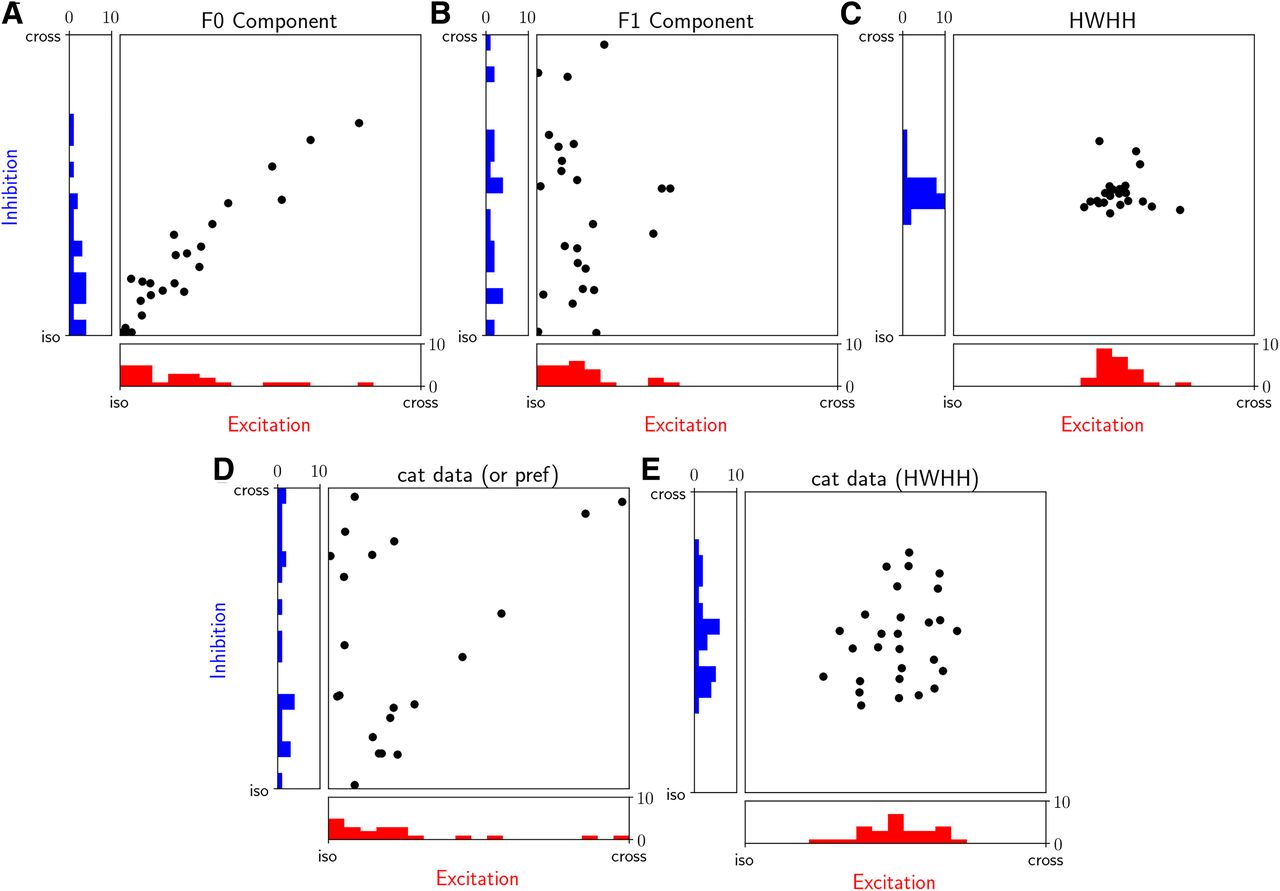
Tuning properties of the excitatory and inhibitory input conductances in excitatory simple cells. A, B, Scatter plot of preferred orientations of gE (abscissa) and gI (ordinates) input conductances in response to the drifting sinusoidal grating stimuli. The preferred orientation of the synaptic input is plotted relative to the orientation preference of the spiking response for each model cell. The iso condition corresponds to the bottom left corner of each scatter plot, where gE, gI and spike output preferences are coaligned. The F0 component was used to compute the orientation preference (A), whereas we used the F1 component of the input conductance (B). C, The HWHH of the excitatory versus inhibitory input conductance tuning curves. D, As in A and B but taken from the in vivo data from simple V1 cells in cat (Monier et al., 2003; Fig. 5, bottom left). Because the test stimulus was a moving bar, the separation into F1 and F0 components was not possible. We have excluded the plot cells shown in Monier et al. (2003), which had low selectivity (Monier et al., 2003, their Fig. 5) because for such cells, the preferred direction preference cannot be determined reliably. E, As in C but data from cat (Monier et al., 2003; Fig. 5, top left). To make the Monier et al. (2003) data directly comparable to the present study, we have collapsed in D and E opposite directions corresponding to the same orientation within the (iso, cross) range. All model data correspond to the condition marked with * in Figure 6D.


