Retinal Ganglion Cell Axon Regeneration Requires Complement and Myeloid Cell Activity within the Optic Nerve
- Sheri L. Peterson1,2,3,5,
- Yiqing Li1,2,3,5,8,
- Christina J. Sun1,2,
- Kimberly A. Wong1,2,3,5,
- Kylie S. Leung1,2,
- Silmara de Lima1,2,3,5,
- Nicholas J. Hanovice1,2,3,5,
- Kenya Yuki1,2,3,5,
- Beth Stevens3,4,7, and
- Larry I. Benowitz1,2,3,5,6
- 1Laboratories for Neuroscience Research in Neurosurgery
- 2Department of Neurosurgery
- 3F.M. Kirby Neurobiology Center, and
- 4Howard Hughes Medical Institute, Boston Children's Hospital, Boston, Massachusetts 02115
- 5Department of Neurosurgery and
- 6Department of Ophthalmology, Harvard Medical School, Boston, Massachusetts 02115
- 7Stanley Center for Psychiatric Research, Broad Institute of Massachusetts Institute of Technology and Harvard, Cambridge, Massachusetts 02142
- 8State Key Laboratory of Ophthalmology, Zhongshan Ophthalmic Center, Sun Yat-sen University, Guangzhou, Guangdong China, 510060
-
Author contributions: S.L.P., Y.L., K.A.W., B.S., and L.I.B. designed research; S.L.P., Y.L., C.J.S., K.A.W., K.S.L., S.d.L., N.J.H., and K.Y. performed research; S.L.P. analyzed data; S.L.P. wrote the first draft of the paper; S.L.P., C.J.S., B.S., and L.I.B. edited the paper; S.L.P. and L.I.B. wrote the paper.
Abstract
Axon regenerative failure in the mature CNS contributes to functional deficits following many traumatic injuries, ischemic injuries, and neurodegenerative diseases. The complement cascade of the innate immune system responds to pathogen threat through inflammatory cell activation, pathogen opsonization, and pathogen lysis, and complement is also involved in CNS development, neuroplasticity, injury, and disease. Here, we investigated the involvement of the classical complement cascade and microglia/monocytes in CNS repair using the mouse optic nerve injury (ONI) model, in which axons arising from retinal ganglion cells (RGCs) are disrupted. We report that central complement C3 protein and mRNA, classical complement C1q protein and mRNA, and microglia/monocyte phagocytic complement receptor CR3 all increase in response to ONI, especially within the optic nerve itself. Importantly, genetic deletion of C1q, C3, or CR3 attenuates RGC axon regeneration induced by several distinct methods, with minimal effects on RGC survival. Local injections of C1q function-blocking antibody revealed that complement acts primarily within the optic nerve, not retina, to support regeneration. Moreover, C1q opsonizes and CR3+ microglia/monocytes phagocytose growth-inhibitory myelin debris after ONI, a likely mechanism through which complement and myeloid cells support axon regeneration. Collectively, these results indicate that local optic nerve complement-myeloid phagocytic signaling is required for CNS axon regrowth, emphasizing the axonal compartment and highlighting a beneficial neuroimmune role for complement and microglia/monocytes in CNS repair.
SIGNIFICANCE STATEMENT Despite the importance of achieving axon regeneration after CNS injury and the inevitability of inflammation after such injury, the contributions of complement and microglia to CNS axon regeneration are largely unknown. Whereas inflammation is commonly thought to exacerbate the effects of CNS injury, we find that complement proteins C1q and C3 and microglia/monocyte phagocytic complement receptor CR3 are each required for retinal ganglion cell axon regeneration through the injured mouse optic nerve. Also, whereas studies of optic nerve regeneration generally focus on the retina, we show that the regeneration-relevant role of complement and microglia/monocytes likely involves myelin phagocytosis within the optic nerve. Thus, our results point to the importance of the innate immune response for CNS repair.
Introduction
Injured axons within the mature mammalian CNS generally cannot regenerate, resulting in permanent functional deficits in patients with spinal cord injury (SCI), traumatic brain injury, stroke, and neurodegenerative diseases (Carmichael et al., 2017; Tran et al., 2018). Although a variety of approaches to promote axon regeneration in animal models have been discovered (D. Wang et al., 2011; Lim et al., 2016; Li et al., 2017; Chen et al., 2018; Yin et al., 2019), the resulting regeneration and functional recovery have been limited, as has clinical translation (J. M. Griffin and Bradke, 2020; but see Kucher et al., 2018). Thus, a more complete understanding of the cellular and molecular factors that influence axon regeneration in the mature CNS is needed to improve outcome beyond current levels.
Neuroimmune interactions modulate critical functions in neuroplasticity (Yirmiya and Goshen, 2011), development, disease, and injury. Although many studies point to detrimental roles for microglia/monocytes (myeloid cells) (Liddelow et al., 2017; Aranda et al., 2019; Norden et al., 2019; Williams et al., 2019) and complement (Fluiter et al., 2014; Williams et al., 2016; Liddelow et al., 2017; Narang et al., 2017; Shi et al., 2017; Bosco et al., 2018; Gassel et al., 2020) in CNS pathology and recovery, notable exceptions are accumulating (Harder et al., 2017; Morán et al., 2017; Stokowska et al., 2017; Brennan et al., 2019; Silverman et al., 2019). We currently lack a systematic understanding of complement and myeloid cell activity in the injured CNS, particularly regarding axon regeneration, as the few studies that have addressed this issue have reached disparate conclusions (detrimental: Guo et al., 2010; Kitayama et al., 2011; Evans et al., 2014; Peterson et al., 2017; neutral: Hilla et al., 2017; beneficial: Cui et al., 2009; Kigerl et al., 2009; Kwon et al., 2015; Peterson et al., 2015), albeit under different contexts.
The effector functions of the classical complement cascade are largely achieved by stimulating microglia/monocytes to migrate, proliferate, and phagocytose. In addition to their role in host defense from pathogens, complement and myeloid cells have diverse functions that are likely relevant to CNS axon regrowth (Peterson and Anderson, 2014), including clearance of myelin (Kopper and Gensel, 2018), dead cells (Silverman et al., 2019), and synapses (Schafer et al., 2012; Hong et al., 2016; Alawieh et al., 2020); neuroprotection (van Beek et al., 2001; Yu et al., 2012; Benoit et al., 2013); and lesion modification (Galvan et al., 2008; Brennan et al., 2019). The clearance functions, for example, are achieved through complement anaphylatoxin-mediated recruitment and phagocytic activation of resident microglia and peripheral blood monocytes, and through target opsonization with complement C3b, which ultimately induces phagocytosis through receptor CR3 on microglia/monocytes. Given the presence of multiple growth inhibitors on disrupted myelin and the likely toxicity of dead cells, these complement-myeloid cell functions have the potential to benefit axon growth in the context of CNS injury. Therefore, it will be important to evaluate this general hypothesis and to dissect the contribution of specific pathways to axon growth, particularly complement-myeloid cell-regeneration pathways.
By virtue of its accessibility, well-defined projections, and sharp separation between the cells of origin (retinal ganglion cells [RGCs]) and their axons, the optic nerve represents an ideal model to systematically investigate the role of complement proteins and myeloid cells in CNS axon regeneration and to develop neuroprotective and pro-regenerative therapies for the visual pathway and elsewhere (Yin et al., 2018; Cameron et al., 2020). Here we report that complement proteins C1q and C3 and microglia/monocyte phagocytic complement receptor CR3 increase following optic nerve injury (ONI), especially within the nerve, where they alter the postinjury environment and are required for axon regeneration.
Materials and Methods
Experimental design and statistical analyses
General
All experiments, surgeries, perfusions, histology, microscopy, image processing, quantification, and exclusions were performed by trained researchers blind to the experimental variable (genotype, treatment, or time point). Control mice/tissues were always included in parallel with, and processed identically to, experimental mice/tissues. When possible, mice or samples were randomly assigned to groups, assay containers, processing order, etc. All images were processed using Fiji/ImageJ software (NIH). Prism (GraphPad) software was used to make all graphs and perform all statistical analyses, including descriptive statistics, one-way ANOVA, two-way ANOVA, t test, and outlier identification (Grubbs', ROUT). All figures were created using Keynote (Apple) or PowerPoint (Microsoft).
Individual experiments
Table 1 and individual subsections below include experiment-specific design details (replicates, sampling, and statistics), which are more briefly and broadly described here. Effect sizes, statistical test names, and p value results are included in Results. Group sizes (N values), graphed data, statistical test names, and significance are also included in the figures and figure legends.
Summary of experimental designs and N values
Our overall goal was to evaluate the role of complement in optic nerve regeneration through multiple descriptive and loss-of-function experiments. We characterized complement proteins, a complement receptor, and monocytes in naive and ONI nerve and retina by immunohistochemistry in three separate experiments, each containing of 5 or 6 groups (naive vs 1, 3, 5, 7, ±14 d post injury [DPI] WT). These tissues were also used to characterize immune cell–myelin interactions. In addition, we characterized naive and postinjury complement production (mRNA) by RNAscope in a single experiment with 3 groups (naive, 1, 7 DPI WT), and by qPCR in two retinal experiments and one nerve experiment, each with 10 groups (sham [uninjured], 1, 3, 5, 14 DPI, each with and without PLX5622 treatment). The role of CR3 in clearance of inhibitory myelin debris was evaluated 5 d after ONI in 2 experiments (untreated, zymosan + cAMP) with 2 groups each (CR3−/− vs CR3+/+ mice). Additionally, WT nerve and retinal tissues from this untreated experiment were processed in parallel to directly compare the complement and monocyte response in each region.
We examined the role of complement proteins and a complement receptor in axon regeneration using genetic deletion and neutralizing antibody strategies in combination with known pro-regenerative and pro-survival treatments. Testing multiple pro-regenerative treatments enabled us to evaluate the generality of each finding. We evaluated the effect of genetic C1q deletion on RGC survival and axon regeneration 14 d after ONI under five experimental conditions (uninjured, injury alone, injury + TPEN [N,N,N′,N′-tetrakis(2-pyridinylmethyl)-1,2-ethanediamine], injury + zymosan + cAMP, and injury + AAV2-shPTEN + oncomodulin + cAMP). Each experimental condition was tested in a separate experiment in which C1q−/− mice were directly compared with C1q+/+ mice, and most individual experiments were repeated (see Table 1). The effect of C3 deletion (C3−/− vs C3+/+) and CD11b (CR3) deletion (CR3−/− vs CR3+/+) on RGC survival and axon regeneration after injury was separately evaluated under the same conditions and experimental design as for C1q. Additionally, we evaluated axon regeneration induced by zymosan + cAMP axon regeneration in mice 5 d after ONI for 4 genotypes in two separate experiments (CR3−/− vs CR3+/+, C1qflx/flx [C1q sufficient] vs C1qflx/flx:CMV-cre [C1q deficient]). Tissues from these experiments were also used to quantify CR3 levels in response to C1q deletion, CR3 levels in relation to pro-regenerative treatments, and myelin clearance in response to CR3 deletion. The effect of C1q function-blocking antibody (anti-C1q vs IgG) on RGC survival and axon regeneration 14 DPI was evaluated under five conditions (injury + zymosan + cAMP [intravitreal anti-C1q vs IgG injection]; injury + zymosan + cAMP [intraperitoneal anti-C1q vs IgG injection]; injury + zymosan + cAMP [intranerve anti-C1q vs IgG injection]; injury + TPEN [intravitreal anti-C1q vs IgG injection]; and injury + AAV2-shPTEN + oncomodulin + cAMP [intraperitoneal anti-C1q vs IgG injection]), which were each tested in separate experiments (some of which were repeated in subsequent experiments). In addition to replicating the KO effect with a nongenetic method that avoids developmental confounds, this set of experiments also investigated the location of the regeneration-relevant C1q.
Animals
All experiments were performed in accordance with the Institutional Animal Care and Use Committee at Boston Children's Hospital and were consistent with federal guidelines for the care and use of laboratory animals. Female and male mice from the following mouse lines were used: C57BL/6J (JAX #000664), 129S (JAX #002448), C1qatm1Mjw (MGI #2158701, C1q A chain KO, referred to here as C1q−/−) (Botto, 1998), B6;129S4-C3tm1Crr/J (JAX #003641, C3 KO, referred to here as C3−/−) (Wessels et al., 1995), and B6.129S4-Itgamtm1Myd/J (JAX #003991, CD11b KO, referred to here as CR3−/−) (Coxon et al., 1996). The C1q, C3, and CR3 mouse lines were bred using heterozygote × heterozygote breeding pairs, with KO and WT littermate controls used for experiments (genotypes checked at weaning and confirmed after each experiment by Transnetyx real-time PCR testing of tail samples). We outbred each colony of mice to its background strain frequently (never >5 generations of inbreeding). All surgeries, including ONI, intravitreal injections, and intranerve injections were performed under ketamine and xylazine general anesthesia and aseptic conditions. Mice received systemic meloxicam analgesia after surgery.
ONI
Optic nerve crush surgeries were performed in 8- to 11-week-old mice as described previously (Meyer and Miotke, 1990; Yin et al., 2009). Briefly, the optic nerve was exposed by conjunctiva incision, then crushed for 5 s using fine-angled forceps (FST Dumont, #5/45, 11251-35) ∼0.5-1 mm behind the eye; successful crush surgery was visually confirmed. Bilateral optic nerve crush was performed in all experiments except those in which anti-C1q antibodies were injected unilaterally (these were ipsilateral to a unilateral crush).
Intravitreal, intranerve, and intraperitoneal injections
Intravitreal injections were performed under ketamine and xylazine general anesthesia in 6- to 10-week-old mice as described previously (Li et al., 2017). In all cases, 3 μl of solution was slowly injected through the sclera into the posterior chamber of the eye using a Hamilton syringe with a 30G needle while carefully avoiding injury to the lens. Intravitreal injections included (all filtered sterile) the following: zymosan (12.5 μg/μl, Sigma, #Z4250, a yeast cell wall preparation that induces inflammation) + CPT-cAMP (50 μm, Sigma, #C3912, a cAMP analog) immediately after injury (promotes RGC survival and axon regeneration) (Yin et al., 2009, 2018; Kurimoto et al., 2013); TPEN (100 μm, EMD Millipore, #616394, a high-affinity Zn2+ chelator with Kd for Zn2+ = 2.6 × 10⁻¹⁶ m; Kd for Ca2+ = 4.0 × 10⁻⁵ m) immediately after and 4 DPI (promotes RGC survival and axon regeneration) (Li et al., 2017); AAV2-H1-shRNA-PTEN-CBA-Flag-mCherry-WPRE-bGHpA virus (referred to here as AAV2-shPTEN-mCherry, 5 × 10¹² GC/ml, Boston Children's Hospital Viral Core, to block PTEN expression in RGCs) (Park et al., 2008; Liu et al., 2010) 14 d before injury + recombinant oncomodulin (rOcm, 30 ng/μl, generated by Yuqin Yin in our laboratory, a growth factor secreted by neutrophils and macrophages) + CPT-cAMP immediately after injury (promotes RGC survival and axon regeneration) (Kurimoto et al., 2010; Cheng et al., submitted); C1q function-blocking antibody (Quidel, #A301, made in goat, 0.1-10 μg/μl; purified 0.1-1.0 μg/μl); PBS (control); and goat IgG (Jackson ImmunoResearch Laboratories, #005-000-003, 0.1-1 μg/μl, control). The efficiency of intravitreal injection methods for delivering treatments was verified in CR3+/+ and CR3−/− retinas by mCherry immunofluorescence 28 d after injection with AAV2-shPTEN-mCherry (14 DPI).
The C1q function-blocking antibody (Hooshmand et al., 2017; Liddelow et al., 2017) was purified using a Pierce Thiophilic Adsorption Kit (Thermo Fisher Scientific, #44916) and verified by gel electrophoresis followed by Coomassie Blue G-250 staining of the gel. The best elution fractions were pooled (fractions 2-4 of 8), buffer was exchanged to TBS using Amicon Ultra-15 30k centrifugal filters (Millipore, #UFC903008), and protein concentration was determined using Bio-Rad microplate protein assay (Bio-Rad, #5000006). In vivo anti-C1q antibody binding and functional C1q neutralization were confirmed in nerve sections immunolabeled for IgG and C3d (see Fig. 8B).
Intranerve injections were performed on 8- to 10-week-old 129S mice; 80 nl of C1q blocking antibody (3.8 μg/μl), purified C1q blocking antibody (2.5 μg/μl), or goat IgG (2.5-3.8 μg/μl, control) was microinjected into the nerve crush site using a Hamilton syringe with a 33G needle and micropump (0.2 μl/min, 40 nl twice), with some (4 of 14) mice receiving a second C1q blocking antibody injection (2.5 μg/μl, purified) and some (4 of 10) mice receiving a second goat IgG injection (2.5 μg/μl) 4 DPI.
Intraperitoneal injections of purified C1q blocking antibody solution (100 μl, 0.03-0.3 μg/μl), goat IgG (0.03-0.3 μg/μl, control), or 0.9% NaCl (control) were performed immediately after injury and 3 and 7 DPI.
Tissue dissections
For all experiments, mice were perfused with 0.9% NaCl followed by 4% PFA. The endpoint for most RGC survival and regeneration experiments was 14 d after ONI; in two subsequent short-term experiments, we assessed regeneration 5 d after ONI. Other experiments used naive mice and postinjury time points of 1, 3, 5, 7, and 14 d. The optic nerves and whole eyes or retinas were dissected out, postfixed in 4% PFA (0.5-2 h depending on the experiment), and stored in 30% sucrose in PBS until cryosectioned or stained. For mRNA experiments, mice were briefly perfused with 0.9% NaCl followed immediately by optic nerve and eye dissections, then mRNA was extracted (qPCR) or tissue was quick-frozen in blocks of OCT Tissue Tek Medium (VWR, #25608930) using an isopentane bath and stored at −80°C until cryosectioned (RNAscope). Lenses were examined during retina dissections, and retinas and optic nerves from cases showing evidence of lens injury (i.e., opaque, shrunken) were excluded from all analyses.
RGC axon regeneration histology and quantification (nerve)
Optic nerves were embedded and frozen in blocks of OCT medium, cryosectioned longitudinally at 14 μm, and mounted onto coated glass slides (in sets). Regenerating axons were immunolabeled using a sheep antibody against growth-associated protein 43 (GAP43; Table 2) followed by an AlexaFluor-488-conjugated donkey secondary antibody to sheep IgG (1:500; Thermo Fisher Scientific, #A11015). Regenerating axons were visualized under fluorescent illumination (Nikon E800 or Nikon 80i with ocular reticule), and were quantified by counting the number of GAP43+ axons crossing a (virtual) line 0.5 mm (and 1.0 mm in select experiments) past the optic nerve crush site and measuring the width of each section (≥4 sections per nerve, ≥28 μm apart). The maximum section width was used to calculate the approximate cross-sectional area of each nerve at 0.5 mm (and 1.0 mm in select experiments), and cross-sectional area together with the section thickness and axon counts were used to estimate the total number of regenerating axons 0.5 mm (and 1.0 mm in select experiments) past the optic nerve crush site, as described previously (Leon et al., 2000). All experiments included a KO or anti-C1q group and a WT or IgG control group, both with (or without) the same pro-regenerative treatment, and most experiments were repeated for a total of 1-3 separate experiments per comparison (each with the manipulated and the associated control groups in parallel; see Table 1 column, No. of separate experiments (pooled)). The data from these repeat experiments were combined/pooled by first expressing each KO (or anti-C1q) and WT (or IgG) value in relation to the mean WT (or IgG) value within each individual experiment (within pro-regenerative treatment), then normalizing to the WT (or IgG) mean of the combined experiments (across experiments; within pro-regenerative treatment). Nerves were excluded if, because of poor tissue dissection or cryosectioning, sections did not include both the crush site and nerve tissue extending at least 0.5 mm past that point. Each (pooled) experiment contained a single KO (or anti-C1q) group and its corresponding WT (or IgG) control group that were subject to the same injury and treatment conditions, and that were directly compared using an unpaired t test. For the intraperitoneal injection anti-C1q experiment, both treatment controls showed similar regeneration (species-matched IgG = 337 ± 68, saline = 319 ± 80), and the two controls were therefore grouped together for statistical analyses. The KO and WT optic nerve axon regeneration images were captured as z stacks using a step size of 1 μm (512 × 512 pixels, 12-bit, averaging four images) at 200× total magnification using a Carl Zeiss LSM710 confocal microscope, processed using Fiji software (NIH), and tiled using PowerPoint (Microsoft). The anti-C1q- and IgG-treated optic nerve regeneration images were captured at 200× total magnification using a Nikon 80i microscope, then processed and tiled using Fiji software (NIH). While GAP43 most prominently labels growing axons, a nonspecific cellular signal is also visible in some images; however, axons are readily distinguished from this other signal when quantifying regeneration at the microscope. Table 1 shows the number of independent replicates (N values).
Antibodies used in immunohistochemistry experiments
RGC survival histology and quantification (retina)
RGC survival was visualized by incubating whole retinas with a rabbit polyclonal antibody against β-III tubulin (Table 2) followed by an AlexaFluor-488-conjugated secondary goat antibody to rabbit IgG (1:500; Thermo Fisher Scientific, #A21206). Retinas were then flat-mounted, and eight microscope images were captured per retina using a predetermined sampling scheme, with four images at 0.5 mm (central) and another four images at 1 mm (peripheral) from the optic nerve head (200× total magnification, Nikon E800). Because of variability in signal intensity within experiments (both positive and nonspecific, both between and within retinas), exposure time was visually adjusted by a blinded, experienced researcher to provide adequate contrast for each image (unlike other analyses in this manuscript, for which within-experiment exposure time was held constant). Some images were excluded from analysis because of poor tissue quality; eight images were quantified for most retinas, but retinas with as few as three quantified images were also included in the dataset (retinas with 0-2 quantified images were excluded). The number of β-III tubulin+ surviving RGCs in each image was manually counted with Fiji software (NIH). The mean RGC count for each retina was transformed to RGC survival density (RGCs/mm2, divided by 0.235 mm2 image area), then expressed as %WT control. For each comparison, 1-3 separate experiments (each with KOs or anti-C1q and the associated WT or IgG controls) were used. Experiments were combined/pooled as described for regeneration quantification above. For the intraperitoneal anti-C1q experiment, controls had similar RGC survival (IgG = 1197 ± 61, saline = 1292 ± 36), and were therefore grouped together for statistical analysis. As these studies were conducted using the same injured mice as for the RGC axon regeneration studies above, replicates (N values) are similar (any differences reflect losses because of tissue processing/quality). In addition, uninjured naive untreated C1q, C3, and CR3 mice were included to verify that general complement KO does not affect the normal development or maintenance of RGCs. For the number of replicates, see Table 1.
Complement protein, monocyte, oligodendrocyte/myelin, and astrocyte histology and quantification (nerve and retina)
All optic nerves and eyes (retinas) for these studies were cryosectioned as described for RGC axon regeneration above, except for cases in which retinas were dissected and whole-mounted as noted. Complement proteins and cell-type markers were visualized immunohistochemically using the following: rabbit anti-C1q (Welsh et al., 2020), goat anti-C3 (Stevens et al., 2007), rabbit anti-C3d, rabbit anti-Iba1, rat anti-CD68, rat anti-CD11b (CR3), goat anti-CD206, rat anti-CD45, rabbit anti-P2RY12, rabbit anti-GFAP, mouse anti-GFAP, rabbit anti-myelin basic protein (MBP), goat anti-olig2, rabbit anti-olig2, and mouse anti-CC1 primary antibodies (see Table 2), followed by a species-appropriate AlexaFluor-488 or -594 IgG conjugated secondary antibody (1:500; Thermo Fisher Scientific, #A11001, A11006, A11007, A11008, A11012, A11055, A21207, A21202), then coverslipped using Fluoromount G-containing DAPI stain (cell nuclei, Invitrogen, #00495952). Isolectin IB4 conjugated to AlexaFluor-488 (endothelial/vasculature, Invitrogen #121411) was used similarly to the primary antibodies (but omitting secondary antibody). The specificity of each antibody was confirmed two ways: absence of or low signal when primary antibody was omitted, and moderate-to-high signal in the expected pattern in positive control tissue (retina or brain). We also validated the specificity of the C1q, C3, and CR3 antibodies by confirming the absence of C1q, C3, and CR3 immunofluorescent signals in optic nerve and brain tissues from mice in which the respective genes were deleted (see Figs. 1, 5; at 14, 1, and 14 DPI, respectively). Image capture, quantification, and analysis details for each set of comparisons are listed below. For replicates (N values), see Table 1.
Characterization of complement proteins in nerve after ONI
For each nerve section containing the injury site (2-4 sections/nerve, ≥28 μm apart), a microscope image (Nikon E800, 200×) of the C3+ immunofluorescent signal centered on the injury site epicenter (crush ± 0.25 mm) was captured and the tissue area analyzed for mean pixel intensity using Fiji software (NIH), then averaged with other sections from that nerve. For uninjured naive nerves, images were centered ∼1.0 mm from the retinal end of the optic nerve sections, the approximate site of injury in experimental animals. Postinjury time points of 1, 3, 5, 7, and 14 d were compared with naive using one-way ANOVA with Dunnett multiple comparison test. Images of DAPI signal were also captured at the same locations. Image capture, quantification, and analysis for nerve C1q were the same as for C3. The C1q antibody was validated in 5 DPI C1q−/− and C1q+/+ tissues.
Characterization of complement proteins in retina after ONI
For each retinal cross-section (4 or 5 sections/retina, ≥56 μm apart), microscope images of the C3 immunofluorescent signal were captured (Nikon E800, 200×) at two predetermined locations (0.5 mm in opposite directions from the optic nerve head; occasional poor quality images were excluded leaving 1 image), and the retinal layers (ganglion cell layer [GCL] with nerve fiber layer [NFL], inner plexiform layer [IPL]) analyzed separately for mean pixel intensity using Fiji software (NIH), then averaged with other images from that retina. Postinjury time points of 1, 3, 5, 7, and 14 d were compared with naive using one-way ANOVA with Dunnett multiple comparison test. Images of DAPI signal were also captured at the same locations. Image capture, quantification, and analysis for retinal C1q were the same as for C3.
Characterization of myeloid cells in nerve after ONI
Image capture and quantification for nerve CD11b+ pixel intensity were the same as for that of C3 and C1q (2-4 sections/nerve, ≥28 μm apart). CD11b+DAPI+ cell number per image, Iba1+DAPI+ cell number per image, and CD11b+Iba1+ colocalization were also quantified (pseudo-count because of very high density at crush site) manually using Fiji (NIH) software. For each image, monocyte activation was assessed by morphology as described previously (Schafer et al., 2012). Briefly, CD11b+DAPI+ cells and Iba1+DAPI+ cells were scored from least activated (0; thin highly branched processes) to most activated (3; no clear processes). Postinjury time points of 1, 3, 5, 7, and 14 d were compared with naive using one-way ANOVA with the Dunnett multiple comparison test.
Characterization of myeloid cells in retina after ONI
Quantification of retinal Iba1+ cell number and morphologic activation was the same as for the nerve, except that it was assessed over the entire retinal section through microscope oculars rather than from images, and that it was restricted to specific retinal laminae as indicated. For each cell, microglia/monocyte activation was also assessed by lysosomal CD68+ signal as described previously (Schafer et al., 2012). Briefly, the CD68+ signal within each Iba1+ cell was scored as 0 (none or sparse), 1 (punctate, covering <50%), or 2 (aggregate or punctate, covering >50%), and averaged over the retina. Quantification of CD11b+ cell number and CD11b+Iba1+ colocalization was the same as for the nerve. Postinjury time points of 1, 3, 5, and 7 d were compared with naive using one-way ANOVA with Dunnett multiple comparison test. Additional mice were used to generate Iba1+CD68+ images from flat-mounted retinae.
Complement protein cell type colocalization in nerve after ONI
Representative images of C1q + GFAP, C1q + CD68, C1q + CR3, C1q + Olig2, C1q + CC1, C1q + TUJ1, C1q + IB4, C3 + CR3, and C3 + TUJ1 immunolabeled (plus DAPI) nerve sections from naive and postinjury time points of 1, 3, 5, 7, and 14 d were captured on a Nikon E800 microscope (100×-400×).
Direct comparison of inflammation in retina versus nerve
Representative images of C1q + C3 + DAPI immunolabeled nerve and retina sections that were processed in parallel from the same 5 DPI mouse were captured on a Nikon 80i microscope (100×), then processed and tiled using Fiji software (NIH).
Postinjury optic nerve myelin time course in relation to monocytes
Representative images of MBP + CR3 and MBP + CD68 immunolabeled nerve sections (with DAPI) from naive and postinjury time points of 1, 3, 5, 7, and 14 d were captured on a Nikon 80i microscope (100×) and processed using Fiji (NIH). In addition, representative z-stack images were captured using a Carl Zeiss LSM700 confocal microscope (400×, 1 μm steps, 2048 × 2048 pixels, 8-bit) and processed using Fiji software (NIH). Importantly, the MBP+ signal that we detected inside CR3+ cells and CD68+ lysosomes in the vicinity of the ONI site at 5-14 DPI was never or very rarely detected in uninjured nerves, or at 1 DPI, or far from the injury site, or when anti-MBP was omitted (secondary antibody only).
Postinjury optic nerve myelin debris removal in CR3−/− mice
For each 5 DPI nerve section containing the injury site (2-4 sections/nerve, ≥28 μm apart), a microscope image (Nikon E800, 100×) of the MBP+ immunofluorescent signal centered on the injury site epicenter was captured and the tissue area (crush site ± 0.2 mm) analyzed for MBP+ area above threshold (% of section) using Fiji software (NIH), then averaged with other sections from that nerve. The CR3−/− data from the untreated and zymosan + cAMP treated 5 DPI experiments (processed separately) were normalized to the with-experiment CR3+/+ data (same treatment condition). CR3−/− nerves were compared with CR3+/+ using a t test. Representative images of CR3+/+ and CR3−/− nerves 14 d after ONI with TPEN treatment were captured similarly but were not quantified because of the small sample size.
Postinjury optic nerve CR3+ monocytes in C1q−/− mice or with pro-regenerative treatments
For each CR3-immunolabeled nerve section containing the injury site (2-6 sections/nerve, ≥28 μm apart), a microscope image (Nikon E800, 100×) of the CR3+ signal centered on the injury epicenter (crush site ± 0.3 mm) was analyzed for CR3+ area above threshold (% of section) using Fiji software (NIH), then averaged with other sections from that nerve. For the comparison (t test) between C1q WT and C1q KO, we used zymosan + cAMP-treated tissues from C1qflx/flx and C1qflx/flx:CMV-cre mice at 5DPI and from C1q−/− and C1q+/+ mice at 14 DPI. The analysis of pro-regenerative treatment effect on CR3 level was a direct within-experiment comparison at 5 DPI (t test), while the analysis at 14 DPI (ANOVA) used WT data from separate (regeneration) experiments with different treatment conditions (untreated, zymosan + cAMP, TPEN).
Complement mRNA analyses (nerve and retina)
Multiplex fluorescence RNA ISH (RNAscope)
Immediately after dissection (see Tissue dissections), optic nerves and eyes were cryosectioned as described for RGC axon regeneration. RNAscope was performed by the Neurobiology Imaging Facility at Harvard Medical School using standard procedures and the following probes: C1q (Mm-C1qa, ACD#441221), C3 (Mm-C3-C3, ACD#417841-C3), dapB-negative control, Polr2a-positive control for channel 1 C1q, UBC-positive control for channel 3 C3. Some slides were subsequently processed for immunohistochemistry using the antibodies and procedure described above. While we had colabeling success with some antibodies (including anti-CD68), other antibodies (including anti-CD11b) were best visualized using an adjacent section from the same nerve. Images of WT naive, 1, and 7 DPI nerve sections labeled with C1q probe, C3 probe, nuclear probe/DAPI, and anti-CD68, or anti-CD11b alone, were captured using a Nikon E800 microscope (600×). Negative and positive control probes produced expected results.
qPCR
PLX5622, a CSF1R inhibitor that depletes microglia, was provided by Plexxikon and formulated in AIN-76A standard chow by Research Diets at 1200 mg/kg as previously described (Elmore et al., 2014). Mice aged 6-8 weeks were fed PLX5622 or control chow from 14 d before ONI until tissue collection. To verify PLX5622-mediated microglial depletion, control (sham surgery, uninjured), 1, and 3 DPI retinas and nerves were processed for immunohistochemistry (Iba1, CR3) as described above. PLX5622-dependent microglia ablation was less effective in injured optic nerves than in retinas. Total mRNA was extracted from control (sham surgery), 1, 3, 5, and 14 d post-ONI retinas or optic nerves using RNeasy Plus Mini or Micro kits (QIAGEN), cDNA was synthesized (Bio-Rad iScript), and real-time PCR (qPCR) was performed using Bio-Rad Iraq Universal SYBR Green Supermix and Roche LightCycler 480 or QuantStudio 7 Flex qPCR system. Primers are listed in Table 3. Ct values were normalized to 18s RNA and fold changes were calculated with respect to control (sham surgery) controls by calculating 2-ΔΔCt. The main effects of injury time (uninjured, 1, 3, 5, 14 d) and treatment (–PLX5622, +PLX5622) were compared using two-way ANOVA, and individual groups were subsequently compared using Dunnett or Sidak multiple comparison tests.
Primers used in qPCR experiments
Results
ONI markedly elevates complement proteins in the optic nerve
We first explored the potential involvement of complement in ONI by complement protein immunofluorescence (Figs. 1, 2). Mouse optic nerves were crushed as described (see Materials and Methods) (Yin et al., 2019), and tissues were collected 1, 3, 5, 7, or 14 DPI. Uninjured mice were included as controls. We examined both optic nerves (which contain the injured RGC axons) and retinas (which contain RGC somata in the GCL, their dendrites in the IPL, and their proximal axons in the NFL). Whereas the preponderance of RGC regeneration studies focus on changes within the retina, we found the most striking changes in complement proteins C3 (central effector) and C1q (classical pathway initiator) to occur within the optic nerve.

Marked elevation of complement proteins near the site of ONI. A, B, Representative full-length injured optic nerve sections (with chiasm) immunolabeled for C3 (A, 1 DPI) or C1q (B, 5 DPI). The largest elevation is at/near the injury site, but complement is also elevated along the entire nerve and chiasm. C, Representative images of uninjured (–) and postinjury (1, 5, 7, and 14 d) optic nerves at the injury site, immunolabeled for C3 (middle row, green in merged) and C1q (bottom row, red in merged). Indicated regions (☐) are enlarged to the right of each image. C3 and C1q proteins both increase locally after injury and are often colocalized or in close proximity. D, E, Quantitative analysis of C3 (D) and C1q (E) immunofluorescence intensity at/near the nerve injury site. F, The specificity of the C3 and C1q antibodies was verified using 1 DPI nerves from C3−/− mice (left) and 14 DPI nerves from C1q−/− mice (right). For this and subsequent figures, the optic nerve is oriented with the eye end to the left and the brain end to the right, and the injury site is marked with a dotted line. N values are shown at the base of the graph bars. Scale bars: A, B, 300 µm; C, 50, 10 µm; F, 50 µm. Graphs represent 25th to 75th percentile (box), median (line), range (whiskers), and individual data points (circles). **p < 0.01, ****p < 0.0001, one-way ANOVA with Dunnett post-test vs uninjured.

Comparatively modest complement protein response in the retina after ONI. A, Representative cross-sections of retinas from uninjured control (–) and optic nerve injured mice (3, 5, 7, 14 DPI), immunolabeled for C3 (middle row, green in merged) and C1q (bottom row, red in merged). Retinal laminae are marked on the right. INL, Inner nuclear layer. B–E, Quantitative analysis of C3 (B,C) and C1q (D,E) immunofluorescence intensity in the GCL/NFL (B,D) and IPL (C,E) shows that C1q levels increase modestly and C3 levels decrease following ONI. F, Retina and optic nerve sections from the same 5 DPI mouse, processed in parallel, reveal a comparatively stronger C1q+ (red) protein response in the nerve, particularly at/near the injury site. Indicated regions (☐) in retina (purple ☐, laminae marked), optic nerve head (orange ☐), and optic nerve (yellow ☐) are shown enlarged nearby. Scale bars: A, 50 μm; F, 300 μm. Graphs represent 25th to 75th percentile (box), median (line), range (whiskers), and individual data points (circles). *p < 0.05, **p < 0.01, ***p < 0.001, one-way ANOVA with Dunnett post-test vs uninjured.
Whereas the uninjured optic nerves exhibited faint cellular immunostaining for C3 and C1q proteins, the immunofluorescence intensity for both increased markedly after injury, especially in the vicinity of the injury site (Fig. 1A–E). For C3, a strong noncellular pattern was prominent at and adjacent to the injury site (including the optic nerve head) at early time points, and may have obscured some cellular staining (Fig. 1A,C). Over time, a relatively weaker but conspicuous cellular pattern emerged (Fig. 1C) that was densest near the injury site but also present distally. The C1q staining pattern appeared to be predominantly cellular at all time points, with a varied morphology that suggests association of C1q with multiple cell types in the injured nerve (Fig. 1B,C). As with C3, the largest C1q increase occurred at the injury site, although C1q elevation was evident along the entire nerve and in the optic chiasm (Fig. 1B). The C3 immunofluorescent signal was elevated above normal levels between days 1 and 5 (Fig. 1A,C,D; 2.5-fold peak at 1 d; p < 0.0001, ANOVA; 1, 3 d p < 0.0001, 5 d p = 0.009, Dunnett test vs uninjured), while C1q was elevated from 5 through 14 DPI (Fig. 1B,C,E; 4.4-fold peak at 14 d; p < 0.0001, ANOVA; 5, 7, 14 d all p < 0.0001, Dunnett test vs uninjured). Although C1q protein elevation was not fully in phase with that of C3, the two were often colocalized in the nerve, especially at later time points (Fig. 1C). Complement proteins are normally activated in a sequential zymogenic cascade, although individual complement proteins can also exert functions independent of the full cascade in nontraditional contexts (Benoit et al., 2012; Berg et al., 2012; Harder et al., 2017). The antibodies used to generate these data were confirmed to be specific, as neither the cellular nor the noncellular patterns were observed in mice with genetic deletion of C1q (Fig. 1F, right: 14 DPI at lesion site, C1q antibody [Table 2, see also Welsh et al., 2020]) or C3 (Fig. 1F, left: C3 antibody, 1 DPI at lesion site, C3 antibody [Table 2, see also Stevens et al., 2007]).
ONI produces comparatively modest complement protein elevation in the retina
The uninjured retina, like the nerve, exhibited only a faint positive signal (above KO controls) for both C3 and C1q proteins (Fig. 2A). In contrast to the nerve, retinal C3 levels decreased after injury, with a trough at 7 d (Fig. 2A–C; 50% decrease in GCL + NFL; p = 0.004, ANOVA; 5 d p = 0.024, 7 d p = 0.0004, Dunnett test vs naive; 46% IPL; p = 0.013, ANOVA; 3 d p = 0.040, 7 d p = 0.003, Dunnett test vs naive). C1q protein was elevated 2.5-fold within the GCL and NFL 5 DPI (Fig. 2A,D; p = 0.001, ANOVA; 5 d p = 0.004, Dunnett test vs naive), but did not change within the IPL (Fig. 2A,E; p = 0.230, ANOVA). Punctate C1q labeling was also present within the outer plexiform layer (OPL) and increased in response to ONI (Fig. 2A; 1.6-fold peak at 14 d; p = 0.042, ANOVA). In summary, C1q increased in the retinal GCL + NFL, IPL, and OPL after ONI, while C3 did not.
Because tissue sectioning, immune labeling, and imaging conditions differed between nerve and retina in the above experiments, these tissues could not be compared directly. To enable us to make direct comparisons, we processed nerve and retina sections in parallel and evaluated C1q and C3 protein signals within individual mice at 5 DPI (Fig. 2F). The C1q protein response was consistently the strongest in the vicinity of the nerve injury site, with a moderate response in the optic nerve head and distal nerve, and a relatively weak response in the retina. These data together with the retinal C3 attenuation data above highlight the strength of the complement reaction within the optic nerve.
C1q is required for axon regeneration but not RGC survival following ONI
We next investigated the functional role of complement proteins in RGC survival and axon regeneration. For this, we performed ONI on complement-deficient mice and quantified the regeneration of GAP43+ immunolabeled RGC axons extending distal to the injury site and the survival of βIII tubulin+ (TUJ1 antibody) immunolabeled RGCs in the retina 14 DPI (Figs. 3, 4). In light of the robust C1q response to injury shown above and several previously described functions for C1q (e.g., classical pathway activation, direct opsonization, signaling through C1q receptors on inflammatory cells, and direct interactions with neurons) (Janeway et al., 2001; Fraser et al., 2010; Benoit et al., 2012; Galvan et al., 2012; Hong et al., 2016; Benavente et al., 2020), we first examined regeneration and survival in C1q−/− mice.

Genetic deletion of C1q, the initiating protein of the classical complement pathway, impairs RGC axon regeneration after ONI. Compared with their C1q+/+ littermates, C1q−/− mice exhibit less optic nerve axon regeneration in response to several pro-regenerative treatments, as assessed histologically 14 DPI. Representative images (A,B,D,E,G,H,J,K,M,N,P,Q,S,T,V,W) and quantification (C,F,I,L,O,R,U,X) of RGC axon regeneration (GAP43+ axons at 0.5 mm distal to injury site; A–C,G–I,M–O,S–U; indicated regions (☐) are enlarged in A′, B′, G′, H′, M′, N′, S′, T′) and RGC survival (TUJ1+ RGC density in retina; D–F,J–L,P–R,V–X) in untreated (A–F) and pro-regenerative treated (G–X) tissues from C1q−/− mice and their C1q+/+ littermates. A–C, Injured C1q+/+ littermate control and C1q−/− mice show very little regeneration in the absence of pro-regenerative treatment. D–F, C1q deletion does not significantly affect RGC survival in the absence of pro-regenerative treatment. G–I, Genetic loss of C1q reduces axon regeneration but (J–L) does not affect RGC survival following treatment with zymosan + CPT-cAMP. M–O, Genetic loss of C1q attenuates axon regeneration but (P–R) does not affect RGC survival following TPEN treatment. S–U, A nonsignificant trend toward decreased axon regeneration, and (V–X) a modestly attenuated RGC survival is observed in C1q−/− mice following treatment with AAV2-shPTEN + oncomodulin + CPT-cAMP. Scale bars: A, B, D, E, G, H, J, K, M, N, P, Q, S, T, V, W, A′, B′, G′, H′, M′, N′, S′, T′, 50 µm. Graphs represent 25th to 75th percentile (box), median (line), range (whiskers), and individual data points (circles). *p < 0.05, ***p < 0.001, ****p < 0.0001, t test.

Complement C3 deletion impairs RGC axon regeneration after ONI. Compared with their C3+/+ littermates, C3−/− mice exhibit less optic nerve axon regeneration in response to several pro-regenerative treatments, as assessed histologically 14 DPI. Representative images (A,B,D,E,G,H,J,K,M,N,P,Q,S,T,V,W) and quantification (C,F,I,L,O,R,U,X) of RGC axon regeneration (GAP43+ axons at 0.5 mm distal to injury site; A–C,G–I,M–O,S–U) and RGC survival (TUJ1+ RGC density in retina; D–F,J–L,P–R,V––X) in untreated (A–F) and pro-regenerative treated (G–X) tissues from C3−/− mice and their C3+/+ littermates. A–C, Injured untreated nerves from both genotypes contain little axon regeneration. D–F, C3 deletion does not affect RGC survival in the absence of pro-regenerative treatment. G–I, Genetic loss of C3 reduces axon regeneration and (J–L) modestly attenuates RGC survival following zymosan + CPT-cAMP treatment. M–O, Genetic loss of C3 attenuates axon regeneration but (P–R) does not affect RGC survival following TPEN treatment. S–U, C3 deletion results in a nonsignificant trend toward impaired regeneration (V–X) with no effect on RGC survival following AAV2-shPTEN + oncomodulin + CPT-cAMP treatment. Scale bars: A, B, G, H, M, N, S, T, 25 µm; D, E, J, K, P, Q, V, W, 50 µm. Graphs represent 25th to 75th percentile (box), median (line), range (whiskers), and individual data points (circles). *p < 0.05, ***p < 0.001, t test.
As expected, in the absence of any treatment after ONI, nerves of C1q+/+ mice contained very few regenerating axons (Fig. 3A,C; 69.2 ± 11.8). Untreated C1q−/− nerves displayed similarly negligible axon regrowth (Fig. 3B,C; 50.6 ± 28.1; p = 0.575, t test). Genetic loss of C1q also did not significantly affect RGC survival (Fig. 3D–F; p = 0.098, t test). These results argue against complement C1q exerting a detrimental effect on RGC survival and axon regeneration.
We next investigated the potentially beneficial effect of C1q by testing whether its deletion diminished the RGC survival and regeneration induced by three established pro-regenerative treatments, the first of which was zymosan plus CPT-cAMP. The induction of a controlled inflammatory reaction via intraocular injection of zymosan, a yeast cell wall preparation, combined with CPT-cAMP, a membrane-permeable nonhydrolyzable cAMP analog, promotes considerable regeneration and survival. Zymosan induces a massive intravitreal influx of neutrophils that secrete the growth factor oncomodulin and macrophages that produce SDF-1, the combined effects of which are further augmented by elevating [cAMP]i (Yin et al., 2009, 2018; Kurimoto et al., 2013). We introduced zymosan + CPT-cAMP by intravitreal injection immediately post-ONI in C1q+/+ and C1q−/− mice and assessed RGC regeneration and survival as described above. Deletion of C1q suppressed axon regeneration induced by zymosan + CPT-cAMP by 60% (Fig. 3G–I; p = 0.0004, t test) without altering RGC survival (Fig. 3J–L; p = 0.135, t test). The observed dissociation between regeneration and survival argues against the regeneration defects of C1q deletion being secondary to impaired RGC survival, and supports the possibility that this loss could reflect a novel, direct effect of complement on axon growth mechanisms. Alternatively, it is possible that these results reflect complement-mediated interference specific to inflammation (zymosan)-induced regeneration that may not occur with other pro-regenerative methods. Accordingly, we tested the generalizability of the regeneration findings using two additional pro-regenerative treatments.
Mobile zinc (Zn2+) increases rapidly in the mouse inner retina after ONI, and blocking Zn2+ accumulation using intravitreally injected chelators promotes substantial RGC axon regeneration and RGC survival (Li et al., 2017). When the Zn2+ chelator TPEN was used as a pro-regenerative treatment, C1q deletion reduced axon regeneration by 78% (Fig. 3M-O; p < 0.0001, t test), again without affecting RGC survival (Fig. 3P–R; p = 0.253, t test).
Finally, we further tested the generalizability of our regeneration findings using a combination treatment comprised of rOcm, CPT-cAMP, and RGC-selective deletion of Pten (AAV2-shPTEN-mCherry). Pten is a tumor suppressor gene that also suppresses CNS axon regeneration and neuronal survival through repression of the PI3K-Akt pathway; Pten deletion using KO mice or shRNA virus promotes spinal cord and optic nerve axon regeneration (Park et al., 2008; Liu et al., 2010). Combining AAV2-shPTEN with CPT-cAMP and either zymosan or rOcm further augments regeneration, enabling some long-distance RGC axon regeneration into the brain (Kurimoto et al., 2010; Cheng et al., 2020). With this combination treatment, we observed a 40% decrease in axon regeneration that was not statistically significant (Fig. 3S–U; p = 0.174, t test) and a 20% decrease in RGC survival (Fig. 3V–X; p = 0.034, t test) in C1q−/− mice.
Collectively, near parallel results with three pro-regenerative treatments (strong, significant attenuation of regeneration in two paradigms and a trend in the same direction in the third) suggest that C1q is required for efficient axon regeneration after ONI and demonstrate the generalizability of C1q-dependent axon regrowth.
C3 is required for axon regeneration but not RGC survival following ONI
In light of the early and persistent C3 accumulation observed within the optic nerve after injury and the downstream position of C3 relative to C1q in the classical complement cascade, we next assessed RGC axon regeneration and survival in mice lacking C3. As in the C1q experiments, untreated nerves from both C3+/+ and C3−/− mice contained very few regenerating axons (Fig. 4A–C; 12.6 ± 5.1, 7.6 ± 2.2; p = 0.361, t test), and C3 deletion did not affect baseline RGC survival (Fig. 4D–F; p = 0.254, t test). C3 deletion diminished axon regeneration induced by zymosan + CPT-cAMP by 75% (Fig. 4G–I; p = 0.0001, t test), with a small but significant effect on RGC survival (Fig. 4J–L; 17% decrease; p = 0.011, t test), and diminished TPEN-induced axon regeneration by 55% (Fig. 4M–O; p = 0.050, t test), with no effect on RGC survival (Fig. 4P–R; p = 0.653, t test). C3 deletion resulted in a 31% decrease in regeneration induced by AAV2-shPTEN + oncomodulin + CPT-cAMP that was not statistically significant (Fig. 4S–U; p = 0.115, t test) and had no effect on RGC survival (Fig. 4V–X; p = 0.984, t test). When we revisited these C3 manipulation experiments to assess axon regeneration further from the injury site, we detected significant regeneration attenuation in C3−/− mice for all 3 treatments (Table 4; zymosan + cAMP: C3+/+ 35 ± 9 N = 6, C3−/− 15 ± 4 N = 9, *p = 0.019; TPEN: C3+/+ 35 ± 8 N = 12, C3−/− 16 ± 5 N = 8, *p = 0.040; AAV2-shPTEN + oncomodulin + cAMP: C3+/+ 138 ± 44 N = 8, C3−/− 55 ± 11 N = 15, *p = 0.013). These data demonstrate that C3 deletion strongly suppresses axon regeneration in response to three separate pro-regenerative treatments, and they suggest that our complement-associated regeneration findings generalize beyond a single distance. Together with the C1q results, these data point to a role of the classical pathway in RGC axon regeneration.
Axon regeneration deficits in complement deficient mice appear to generalize beyond a single distance and time pointa
Complement C3b phagocytosis receptor CR3 is associated with microglia/monocytes and increases dramatically within the injured optic nerve
Cleavage of C3 protein by a C3 convertase (cascade-dependent) or alternative serine protease (cascade-independent) produces two potent effector proteins, C3a and C3b. C3b, as an opsonin, induces phagocytosis of opsonized particles through CR3 (complement receptor 3, mac1, integrin αMβ2, CD11b/CD18) on phagocytes, a role that could potentially improve regeneration through clearance of dead cells and debris and remodeling the postinjury environment. Accordingly, we next characterized the CR3+ phagocyte response to ONI (Figs. 5, 6). Within the injured optic nerve, local accumulation of CR3+ myeloid cells was dramatic, rapid, and enduring (Fig. 5A–C). The density of CR3 receptors per cell also appeared to increase after injury, in line with a previous report in an optic nerve transection (cut) model (Reichert and Rotshenker, 1996). The number of CR3+ cells increased ninefold above uninjured controls by 1 DPI (Fig. 5A,B; p < 0.0001, ANOVA; p = 0.019, Dunnett test vs uninjured) and rose to 25- to 30-fold above uninjured controls between days 5 and 14 (5, 7, 14 d all p < 0.0001, Dunnett test vs uninjured). Concomitantly, the CR3 immunofluorescence signal increased 2.5-fold above uninjured controls by 1 DPI and remained elevated for at least 2 weeks, with a 3.5-fold peak at 7 d (Fig. 5A,C; p < 0.0001, ANOVA; 1 d p = 0.031, 3 d p = 0.003, 5 and 7 d p < 0.0001, 14 d p = 0.001, Dunnett test vs uninjured). Similar to the complement proteins after ONI (Fig. 1), CR3 levels were elevated along the entire nerve and chiasm, with the highest CR3 levels and the greatest accumulation of large, spherical CR3+ cells occurring at and just rostral to the injury site starting 3 DPI (Fig. 5A,G). Mice lacking Itgam, the gene encoding CR3, showed no CR3+ immunostaining in the injured optic nerve, demonstrating the specificity of the CD11b antibody used to generate these results (Fig. 5D).

Marked increase in CR3 near the site of ONI. Complement C3b phagocytosis receptor CR3 is microglia/monocyte-specific, and CR3+ microglia/monocyte number and phagocytic activation increase within the injured optic nerve. A, Representative images of CR3 immunolabeled uninjured (–) and injured (1, 3, 5, 7, 14 DPI) optic nerves at the injury site. Indicated regions (☐) are shown enlarged to the right of each image. Note the accumulation of CR3+ cells and the increased cellular signal intensity following ONI. B, C, Quantitation confirms that the approximate number of CR3+ cells (B) increases rapidly (by 1 DPI) and is sustained for at least 14 DPI, with a 30-fold peak at 5 DPI; likewise, CR3 immunofluorescence intensity (C) is elevated at all postinjury time points evaluated (1-14 DPI). D, The specificity of the CR3 (CD11b) antibody was verified using 14 DPI nerves from CR3+/+ (left) and CR3−/− mice (right). E, The approximate number of Iba1+ microglia/monocytes in the nerve increases dramatically by 5 DPI and remains elevated until at least 14 DPI. F, Quantitation of CR3+Iba1− (red), CR3-Iba1+ (green), and colocalized CR3+Iba1+ (yellow) cells at/near the injury site. While most CR3+ optic nerve cells are microglia, some CR3+ cells in the injured nerve are likely infiltrating peripheral blood monocytes. G, CR3 (red) colocalization with Iba1 (green; microglia) at nerve injury site (3, 5 DPI), in the distal nerve (3 DPI), and in the chiasm (14 DPI). H–J, Presence of myeloid cell markers CD206 (H), CD45 (I), and P2RY12 (J) in 14 DPI optic nerves. Iba1+ and CR3+ microglia/monocytes at/near the injury are large, round, and lack processes: morphologic changes associated with phagocytic activation. L, Similarly, these Iba1+ (green) microglia/monocytes express strikingly high levels of lysosome marker CD68 (red; observed 3-14 DPI, 14 DPI shown). M, C1q deletion dampens the CR3+ cell response to injury plus zymosan + CPT-cAMP treatment at 5 and 14 DPI. N, Pro-regenerative treatments may augment the CR3+ cell response in the injured nerve at 14 DPI. Scale bars: A, 50 µm, 10 µm; D, G, H, I, J, L, 50 µm. Graphs represent either mean ± SEM or 25th to 75th percentile (box), median (line), range (whiskers), and individual data points (circles). B, C, E, K, *p < 0.05, **p < 0.01, ***p < 0.001, ****p < 0.0001, one-way ANOVA with Dunnett post-test vs uninjured or untreated. J, **p < 0.01, t test.

Comparatively modest CR3+ cell response in the retina after ONI. Although CR3+ microglia and phagocytic activation both increase after ONI, the retinal cellular inflammatory response is less robust than that in the nerve. A, B, Images of retinal whole mounts (A) and retinal cross sections (B) from uninjured (–) and ONI (1, 3, 5, 7 DPI) mice, immunolabeled for Iba1 (microglia, green) and CD68 (lysosomes, red), showing increased microglial number and activation after ONI. C, Quantitation of Iba1+ microglia in the indicated laminae over time indicates that microglia accumulate in the IPL and GCL, peaking at 5 DPI. D, After ONI, Iba1+ microglia within the GCL + IPL demonstrate changes in morphology associated with phagocytic activation. E, Elevated CD68+ lysosomal content. Images (F) and quantitative analysis (G) of complement C3b phagocytosis receptor CR3 (red) near exclusive colocalization (yellow) with Iba1+ (green) cells in retina. In both the uninjured and injured retinas, all CR3+ cells appear to be microglia. H, CR3+ microglia accumulate within the GCL + IPL after ONI. I, J, Representative images of Iba1+ (I) and CR3+ (J) microglia/monocytes in optic nerve head after ONI (nerve, retina, and retinal laminae marked). Note stronger microglia/monocyte response in the optic nerve head versus the retina. K, Retinal and optic nerve sections from the same 5 DPI mouse, processed in parallel, reveal a comparatively stronger Iba1+ (green) and CR3+ (red) cell responses in the nerve. Indicated regions (☐; purple represents retina; orange represents optic nerve head; yellow represents nerve) are enlarged below. Compared with the ONI site, the microglia/monocyte inflammatory response in the distal nerve and optic nerve head is moderate, and in the retina it is weak. Scale bars: A, B, F, 10 µm; I, J, 50 µm; K, 300 µm, 20 µm. Graphs represent either mean ± SEM or 25th to 75th percentile (box), median (line), range (whiskers), and individual data points (circles). *p < 0.05, **p < 0.01, ****p < 0.0001, one-way ANOVA with Dunnett post-test vs uninjured or untreated.
CR3 is found on blood monocytes, tissue macrophages, microglia, neutrophils, lymphocytes, bone marrow, and spleen cells, although within the normal adult CNS, its expression is largely restricted to microglia (Barnum, 1995; Morgan and Gasque, 1997; Rotshenker, 2003). In light of the striking changes in CR3+ cells within the ONI site observed here and the previously described monocyte infiltration into the optic nerve in glaucoma and ONI models (Jander et al., 2001; Bennett et al., 2016; Norris et al., 2018; Smith et al., 2018; Williams et al., 2019), we expected that injured nerves would contain both resident CR3+ microglia and infiltrating CR3+ peripheral immune cells. Ionized calcium binding adaptor molecule 1 (Iba1) is exclusively expressed by microglia in the mature intact CNS, although infiltrating peripheral monocytes likely begin to express Iba1 after entering the injured CNS environment (Menasria et al., 2015; Bennett et al., 2016). The overall response of Iba1+ cells to ONI was similar to that of CR3+ cells, with pronounced cell accumulation beginning 5 DPI (Figs. 5E,L and 6K; 5 d 4.5-fold, 7 d 3.3-fold, 14 d 4.6-fold; p < 0.0001, ANOVA; 5 d p = 0.001, 7 d p = 0.027, 14 d p = 0.0004, Dunnett test vs uninjured). CR3 was elevated sightly in advance of Iba1, possibly because of a delay between CR3+ monocyte infiltration into the CNS and expression of microglial markers by these cells. As expected, the majority of monocytes/microglia in the uninjured optic nerve were CR3–Iba1+ (or possibly CR3loIba1+), with occasional CR3+Iba1+ cells and few CR3+Iba1– cells (Fig. 5F). Therefore, most myeloid cells in the normal optic nerve appeared to be microglia with low or no expression of CR3, whereas after injury, most myeloid cells at/near the crush site were CR3+Iba1+, with some CR3+Iba1– cells and rare CR3–Iba1+ cells (Fig. 5F,G). Other myeloid cell markers are also present in the injured optic nerve, with dense CD206+ (Fig. 5H) and CD45+ cells (Fig. 5I) and sparse P2RY12+ cells (Fig. 5J) within and immediately distal to the injury site, and an accumulation of P2RY12+ cells (Fig. 5J) just beyond that (14 dpi). These observations suggest that a combination of resident microglia (that proliferate and increase their CR3 expression) and nonmicroglial CR3+ cells (that infiltrate and/or proliferate) likely responds to ONI.
We also examined the phagocytic activation of microglia/monocytes by morphology (Fig. 5K) and CD68 lysosomal levels (Fig. 5L). At the injury site, cells that were Iba1+ and/or CR3+ by immunostaining were large, round, and lacked processes, indicating high phagocytic activation at all time points (Fig. 5A,G,H). Phagocytic activity was also evident by the exceptionally high CD68+ lysosome volume in Iba1+ cells 3-14 DPI (Fig. 5L). Thus, the cellular and protein substrates for complement C3b-CR3-mediated phagocytosis are abundant in the injured optic nerve microenvironment.
Complement and pro-regenerative treatments each enhance the CR3+ cell response
In general, C1q can recruit or activate immune cells either directly or via complement cascade anaphylatoxins. To investigate the influence of C1q on the response of CR3+ myeloid cells to ONI, we compared the CR3 immunofluorescent signal in optic nerves from C1q-sufficient (C1q+/+ or C1qflx/flx) and C1q-deficient (C1q−/− or C1qflx/flx:CMV-cre) mice 5 and 14 d after ONI plus treatment with zymosan + CPT-cAMP (Fig. 5M). Genetic deletion of C1q suppressed the CR3+ cell response substantially but incompletely (14 d 41% decrease, p = 0.006; 5 d 22% decrease, p = 0.037; t tests), presumably because of the presence of other pro-inflammatory stimuli. We also quantified the CR3+ myeloid cell response to pro-regenerative treatments as an initial test of CR3 relevance to RGC axon regeneration, and found that some treatments may augment the later accumulation of CR3+ cells at the nerve injury site (Fig. 5N; 14 d p = 0.049, ANOVA; p = 0.041 Dunnett test zymosan + CPT-cAMP vs untreated).
ONI leads to comparatively modest CR3 changes in the retina
The CR3+ phagocyte response in the retina paralleled that of the nerve but was less pronounced (Fig. 6). The largest and most enduring increase in retinal Iba1+ microglia occurred within the IPL, exposing RGC dendrites, their afferents from amacrine and bipolar cells, and Müller glia to increased numbers of phagocytic microglia through at least the first week after ONI (Fig. 6A–C; 5.4-fold increase at 5 d peak; time p < 0.0001, layer p < 0.0001, mixed-effects model analysis; 1 d p = 0.040, 3 d p = 0.012, 5 d p = 0.002, 7 d p = 0.020, Dunnett test vs uninjured). Iba1+ microglia also accumulated in the GCL alongside RGC somata (5 d 3.9-fold increase; 5 d p = 0.004, Dunnett test vs uninjured), and a modest Iba1 elevation was detected in the OPL 1 DPI (1 d 1.5-fold increase; 1 d p = 0.038, Dunnett test vs uninjured). Following ONI, retinal microglia displayed a moderately activated morphology with thicker, unbranched processes and slightly enlarged cell bodies (Fig. 6A,B,D,F; 1.6-fold peak at 5 d; p = 0.0001, ANOVA; 5 d p < 0.0001, 7 d p = 0.015, Dunnett test vs uninjured), and contained more intense CD68+ immunolabeling, indicating phagocytic activation (Fig. 6A,B,E; 1.5-fold peak at 5 d; p < 0.0001, ANOVA; 3 d p = 0.037, 5 d p < 0.0001, Dunnett test vs uninjured). As expected, CR3 was localized nearly exclusively on Iba1+ microglia in the normal retina (Fig. 6F,G). Although the proportion of retinal myeloid cells that were CR3+ increased after ONI, very few CR3+Iba1– cells were present (Fig. 6G), suggesting that almost all injury-induced retinal CR3+ cells are local microglia rather than infiltrating blood-derived monocytes. The distribution and accumulation of CR3+ protein followed that of Iba1, increasing 3.2-fold in the IPL and GCL 5 d after ONI (Fig. 6H; p = 0.005, ANOVA; 5 d p = 0.004, Dunnett test vs uninjured).
In retinal sections from ONI mice, the optic nerve head contained a relatively high density of Iba1+ (Fig. 6I) and CR3+ microglia/monocytes (Fig. 6J). Because retinas and optic nerves were generally processed separately for detailed analysis, we also prepared several cases to compare the injury-induced microglia/monocyte response in these two regions directly (Fig. 6K; processed in parallel under identical conditions). The Iba1+ and CR3+ inflammatory cell reaction was strongest at the nerve injury site, with moderate effects in the optic nerve head and distal nerve, and a relatively modest retinal response (Fig. 6K). These data, together with those shown in Figures 1 and 2, suggest that axon regeneration may be influenced by neuroimmune interactions occurring primarily within the optic nerve.
CR3 is required for optic nerve regeneration
We next investigated the role of microglia/monocyte phagocytic complement receptor CR3 in RGC axon regeneration using CR3−/− and CR3+/+ littermates under the same conditions as in the C1q and C3 experiments (Fig. 7). Overall, CR3 deletion phenocopied the effects of C1q deletion and C3 deletion in suppressing axon regeneration. None of the complement deletions (CR3, C1q, C3) significantly affected the baseline RGC density in naive (uninjured untreated) mice (CR3+/+ 2483 ± 197 N = 7, CR3−/− 2265 ± 143 N = 8, p = 0.376; C3+/+ 2168 ± 131 N = 6, C3−/− 2067 ± 80.4 N = 6, p = 0.525; C1q+/+ 2510 ± 54 N = 3, C1q−/− 1899 ± 215 N = 3, p = 0.051; t tests), although there was a trend in the case of C1q deletion. CR3 deletion decreased TPEN-mediated axon regeneration by 62% (Fig. 7A–C; p = 0.016, t test) without affecting RGC survival (Fig. 7D–F; p = 0.388, t test). Similarly, CR3 deletion reduced axon regeneration induced by AAV2-shPTEN + oncomodulin + CPT-cAMP (Fig. 7G–I; 34% decrease; p = 0.050), again without affecting survival (Fig. 7J–L; p = 0.259, t test). The intravitreal injections of pro-regenerative treatments were equally efficient in mice of both genotypes after ONI (Fig. 7M). As expected, untreated nerves from both genotypes contained little axon regeneration (Fig. 7N; 15.5 ± 4.5, 13.9 ± 5.6; p = 0.851, t test). Similar to our C1q and C3 findings, CR3 deletion substantially reduced axon regeneration induced by zymosan + CPT-cAMP (Fig. 7O; 64% decrease; p = 0.002, t test), again without reducing RGC survival (Fig. 7P, untreated, p = 0.073, t test; Fig. 7Q, zymosan + CPT-cAMP, 31% increase, p = 0.041, t test). When we repeated this experiment at an earlier, 5 DPI time point, we found a nonsignificant trend in the predicted direction (Table 4; 40% decrease, p = 0.097, t test), which may also generalize to complement protein-deficient mice (Table 4; C1qflx/flx:CMV-cre 19% decrease, p = 0.192, t test). The dissociation between regeneration and survival provides further evidence that the primary effect of complement deletion is on regeneration per se. Together with our data showing that C1q and C3 are required for RGC axon regeneration (Figs. 3, 4) and that CR3+ cells respond robustly to ONI (Fig. 5), these CR3 regeneration data further support a role for the classical complement cascade and C3b-CR3 myeloid cell mediated phagocytosis in RGC axon regeneration.

CR3 deletion impairs RGC axon regeneration without affecting survival after ONI. Compared with their CR3+/+ littermates, CR3−/− mice exhibit less axon regeneration in response to several pro-regenerative treatments, as assessed histologically at 14 DPI. Representative images (A,B,D,E,G,H,J,K) and quantification (C,F,I,L,N–Q) of RGC axon regeneration (GAP43+ axons at 0.5 mm distal to injury site; A–C,G–I,N,O; indicated regions (☐) are enlarged in A′, B′, G′, H′) and RGC survival (TUJ1+ RGC density in retina; D–F,J–L,P,Q) in untreated (N,P) and pro-regenerative treated (A–L,O,Q) tissues from CR3−/− mice and their CR3+/+ littermates. A–C, Genetic loss of CR3 attenuates axon regeneration, (D–F) without affecting RGC survival following TPEN treatment. G–I, Genetic deletion of CR3 impairs AAV2-shPTEN + oncomodulin + CPT-cAMP-mediated axon regeneration, but not (J–L) RGC survival. M, The efficiency of intravitreal injections to deliver pro-regenerative treatments was verified in CR3+/+ and CR3−/− retinas by mCherry immunofluorescence at 28 d after injection with AAV2-shPTEN-mCherry (14 DPI). N, Untreated nerves from both genotypes exhibit very little axon regeneration. O, CR3 deletion reduces zymosan + CPT-cAMP-mediated axon regeneration. P, CR3 deletion does not affect RGC survival following untreated ONI and (Q) modestly improves RGC survival following zymosan + CPT-cAMP treatment. Scale bars: A, B, D, E, G, H, J, K, A′, B′, G′, H′, 50 µm; M, 250 µm. Graphs represent 25th to 75th percentile (box), median (line), range (whiskers), and individual data points (circles). *p < 0.05, ***p < 0.001, t test.
C1q exerts its regeneration-associated effects primarily within the optic nerve
A priori, complement could be influencing axon regeneration through direct interactions with RGCs or their axons, or through indirect effects on glial and inflammatory cells in the retina or optic nerve. Although the robust complement and cellular response in the optic nerve (Figs. 1, 2, 5, 6) suggest that the nerve may be the critical site of action, it remains possible that complement interacts directly with RGC somata, dendrites, proximal axons, glial cells, or inflammatory cells in the retina to influence RGC axon regeneration. Accordingly, we investigated the pertinent site at which complement influences regeneration using localized injections of an established C1q blocking antibody (Fig. 8; Table 2) (Hooshmand et al., 2017; Liddelow et al., 2017) that we further purified and verified (see Materials and Methods). For these experiments, all mice received ONI, followed by an intravitreal injection of zymosan + cAMP, and either C1q function-blocking antibody (goat) or IgG (goat) control injection(s) through one of three routes: intravitreal, intranerve, or intraperitoneal (Fig. 8A). To confirm binding of anti-C1q and its functional interference in optic nerve tissue after in vivo anti-C1q injection, we immunolabeled 14 DPI nerve sections for IgG (anti-goat IgG secondary antibody without primary antibody) and C3d, then evaluated the region immediately distal to the injury site (Fig. 8B). As expected, optic nerves from mice with ONI plus intranerve or intraperitoneal injections of C1q blocking antibody exhibited a stronger IgG signal and slightly weaker C3d signal compared with nerves from mice with ONI plus IgG control injections or intravitreal injections.

C1q neutralization within the optic nerve diminishes RGC axon regeneration. A, Experimental design. Optic nerves (black lines) were injured (red triangles, 0 DPI), followed immediately by intravitreal injections of pro-regenerative zymosan + cAMP (green syringes, 0 DPI); tissues were collected 14 DPI. C1q function-blocking antibody (purified IgG, goat), IgG control (goat), or saline control was injected into different sites to investigate the locus of C1q's role in regeneration. The route, timing, and associated figure panels for each experiment are indicated. B, Immunohistochemical validation of anti-C1q in vivo injections, showing increased IgG signal (from fluorescent goat IgG secondary antibody) and slightly decreased C3d signal (opsonization) in optic nerves of mice that received intranerve or intraperitoneal injection of (goat) anti-C1q compared with those injected with (goat) IgG control. C, Intravitreal injection of anti-C1q (0.3-30 µg) does not affect zymosan + CPT-cAMP-mediated RGC regeneration (0.3-3 µg IgG control) or (D) RGC survival. E, In contrast to intravitreal injection, intranerve injection of anti-C1q (0.3 µg) reduces zymosan + cAMP-mediated RGC axon regeneration (0.3 µg IgG control), and (F) without affecting RGC survival. G, H, Representative images of GAP43-immunolabeled optic nerves from zymosan + cAMP-treated, intraperitoneal IgG (G, 3 µg) and anti-C1q (H, 3 µg) injected WT mice. Indicated regions (☐) are enlarged in G′ and H′. I, Quantitation demonstrates that intraperitoneal injection of anti-C1q (3-30 µg) attenuates axon regeneration induced by zymosan + cAMP (3-30 µg IgG or saline control), and (J) without affecting RGC survival. Scale bars: B, G, G′, H, H′, 50 µm. Graphs represent 25th to 75th percentile (box), median (line), range (whiskers), and individual data points (circles). *p < 0.05 (t test).
Whereas intravitreal anti-C1q injection did not alter RGC axon regeneration (Fig. 8C; p = 0.275, t test) nor survival (Fig. 8D; p = 0.486, t test), intranerve (Fig. 8E,F) and intraperitoneal (Fig. 8G–J) injections of anti-C1q each diminished regeneration by half (intranerve: Fig. 8E; 50% decrease, p = 0.018, t test; intraperitoneal, Fig. 8G–I; 46% decrease, p = 0.034) with no significant effect on RGC survival (intranerve: Fig. 8F; p = 0.080, t test; intraperitoneal: Fig. 8J; p = 0.287, t test). Intravitreal injection of anti-C1q also failed to affect TPEN-mediated axon regeneration (141.6 ± 29.2, 160.1 ± 27.8; p = 0.328, t test). Intraperitoneal injections of anti-C1q did not attenuate AAV2-shPTEN + oncomodulin + cAMP-mediated axon regeneration (IgG 579.8 ± 55.6 N = 7, anti-C1q 630.0 ± 68.2 N = 8, p = 0.287, t test), although this outcome might have been predicted based on the nonsignificant trend observed in the C1q KO mice. In summary, intranerve and systemic C1q antibody injections generally phenocopied the effects of complement deletion in diminishing optic nerve regeneration, whereas intravitreal injections did not. These results imply that the primary site of complement activity required for axon regeneration is within the optic nerve. In addition, by corroborating the findings from our C1q, C3, and CR3 gene deletion experiments, the antibody blocking results argue against the possibility that the observed KO regeneration deficits resulted from altered development.
C1q is produced by local microglia
In addition to circulating serum complement proteins of hepatocyte origin that may enter the CNS through a disrupted blood–brain barrier (BBB), local CNS complement expression by infiltrating immune cells, resident glia, and neurons is also well documented (Woodruff et al., 2010; Peterson and Anderson, 2014). To determine the identity of complement-expressing cells in this model, we performed RNAscope ISH plus fluorescent immunohistochemistry in optic nerve and retina sections after ONI (Fig. 9A–C).

Complement is produced by microglia and other cells in the injured optic nerve. A, Representative images of 1 and 7 DPI nerve sections after RNAscope using a C1q mRNA probe. A small population of local cells produces C1q shortly after ONI, as do many of the cells that subsequently accumulate within the injury site. B, Representative images of 7 DPI adjacent sections from the same nerve processed for C1q mRNA (top) and CR3 protein (bottom) suggest C1q production by CR3+ microglia/monocytes within the injury site. C, Representative image of 7 DPI nerve section after RNAscope procedure using C1q (red) and C3 (green) mRNA probes followed by immunohistochemistry using CD68 (white) antibody. Most C1q+ cells and many C3+ cells are also CD68+, suggesting that phagocytic monocytes in and near the injury site contribute to ONI-induced complement elevation. D, Sham-injury (no ONI) and 14 DPI nerve sections from mice treated with control (left) or PLX5622 (right) chow, immunostained for Iba1 and CR3. PLX nearly eliminates microglia in the sham-injury (no ONI) optic nerve, but is not as effective after ONI, especially for CR3+ microglia/monocytes at/near the injury site. E–G, ONI and PLX treatment each affects local expression of Aif1 (Iba1 microglia/monocytes, E), C1qa (C1q, F), and C3 (G) within the nerve, as analyzed by qPCR. The reduction in C1q (but not C3) mRNA with PLX implicates microglia in local naive and injury-associated C1q production. H, Sham-injury (no ONI) and 14 DPI retinal whole mounts from mice treated with control (left) or PLX (right) food. PLX nearly eliminates microglia in both sham and ONI retinae. I, J, qPCR analysis reveals that ONI and PLX treatment each affects expression of Aif1 (Iba1+ microglia/monocytes, I) and C1qa (C1q, J) within the retina, and points to microglia as the primary source of retinal C1q expression. Scale bars: A–D, H, 50 µm. N values: 4/group for retina qPCR, 2 or 3/group for nerve qPCR. Data are mean ± SEM. Two-way ANOVA (main effects of injury time and PLX treatment) with Dunnett or Sidak post-test: *p < 0.05, ****p < 0.0001 vs same chow sham-injured; ##p < 0.01, ###p < 0.001, ####p < 0.0001 vs control chow at same time point.
As predicted from our protein data above (Fig. 1) and from previous studies showing complement production by microglia under normal and pathologic conditions (R. S. Griffin et. al., 2007; Howell et al., 2011; Fonseca et al., 2017; Silverman et al., 2019), we detected a strong C1q mRNA signal in the injured nerve that was mainly localized to CR3+ (Fig. 9B) CD68+ (Fig. 9C) microglia/monocytes at the injury site. The comparatively weaker C3 mRNA signal was localized to both CD68+ and CD68– cells at the injury site (Fig. 9C), suggesting that some C3 protein in the injured optic nerve is produced by both nonmyeloid local (e.g., astrocytes) and systemic sources (e.g., hepatocytes/blood). Complement C1q and C3 mRNA signals were only infrequently detected in GFAP+ astrocytes and were not detected in Olig2+ oligodendrocytes. In agreement with our other nerve versus retina comparison data, we detected very little complement C1q or C3 mRNA signal in naive and 1DPI retinas (not shown), although the assay sensitivity and time points studied likely underestimate retinal complement production.
To confirm the optic nerve results and to test the relative contribution of microglia to local postinjury complement accumulation, we measured C1q and C3 mRNA by qPCR after depleting microglia using the CSF1R inhibitor PLX5622 (Fig. 9D–J) (Elmore et al., 2014; Hilla et al., 2017; Li et al., 2020). As expected, PLX5622 nearly eliminated microglia-associated proteins (Fig. 9D; Iba1, CR3) and mRNA (Fig. 9E; Aif1; 81% decrease) in the sham (uninjured) optic nerve. However, PLX5622 was somewhat less effective in reducing Aif1+ microglia/monocytes after ONI (Fig. 9D,E; 1 d 48%, 3 d 82%, 5 d 67%, 14 d 54% decrease vs same-day control; p = 0.017, two-way ANOVA treatment main effect; p > 0.316, all post-tests for PLX5622 vs same day control), especially for CR3+ cells near the injury site, which may have actually increased (Fig. 9D). This apparent compensation in CR3+ cells precludes using PLX5622 as an appropriate tool for manipulating regeneration-relevant CR3+ microglia/monocytes in our model. Our qPCR-based time course data roughly mirrored that of the protein (Figs. 1, 2), with C1q mRNA elevated 3-14 DPI (Fig. 9F; 7.1-fold increase at 14 d peak; p < 0.0001, two-way ANOVA injury time main effect; control 3 d p = 0.034, 5 d and 14 d p < 0.0001, post-test vs control uninjured), and C3 mRNA elevated at 1 d (Fig. 9G; time point of maximum diffuse protein signal; 3.1-fold increase; p = 0.0039, two-way ANOVA injury time main effect; control 1 d p = 0.092, post-test vs control uninjured) and 14 d (time point of maximum cellular protein signal; 3.4-fold increase; control 14 d p = 0.032, post-test vs control uninjured) after injury. C1q mRNA was reduced but not eliminated in PLX5622-treated mice (Fig. 9F; 46%-85% decrease; p < 0.0001, two-way ANOVA treatment main effect; PLX5622 3 d p = 0.002, 5 d and 14 d p < 0.0001, post-test vs same day control), implicating microglia in local naive and injury-associated C1q production. On the other hand, PLX5622-mediated ablation of local microglia did not consistently diminish C3 mRNA expression (Fig. 9G; 45% decrease to 186% increase; p = 0.980, two-way ANOVA treatment main effect), further suggesting that, although some C3 is indeed produced locally after ONI, microglia are not the predominant source.
In contrast to the limited effectiveness of PLX5622 in the optic nerve after ONI, PLX5622 eliminated nearly all microglia in both sham and ONI retinas, as shown by retinal immunohistochemistry (Fig. 9H) and qPCR (Fig. 9I; 99% decrease at 14 d; p < 0.0001, two-way ANOVA treatment main effect; PLX 5 d p = 0.003, 14 d p = 0.002, post-test vs same day control). PLX5622 treatment essentially eliminated C1q mRNA (Fig. 9J; 94%-98% decrease; p < 0.0001, two-way ANOVA treatment main effect; 1 d p = 0.010, 3 d p = 0.006, 5 d p < 0.0001, 14 d p = 0.0003, post-test vs same day control), suggesting that retinal C1q derives almost exclusively from microglia. Overall, these data suggest that microglia/monocytes produce complement normally, and that those associated with the injury site contribute to postinjury complement elevation, although other cells and serum (hepatocyte synthesis and BBB disruption) are also likely to contribute.
Complement proteins may interact with multiple cell types after ONI
In addition to expressing complement, microglia/monocytes likely also respond to complement after ONI by becoming polarized, releasing cytokines, and/or increasing phagocytic activity that may affect axon regeneration by modifying the injured nerve microenvironment through which axons must regrow. In light of the diverse morphology of the immunolabeled complement-positive cells in the nerve (Fig. 1) and retina (Fig. 2), it is possible that complement proteins interact with multiple cell types after ONI. To characterize the cellular localization of complement proteins after ONI, we coimmunolabeled naive and post-ONI tissue for C1q or C3 in combination with markers for microglia/monocytes, astrocytes, endothelial cells, oligodendrocytes, or RGCs (Fig. 10). C1q and C3 colocalized with CR3+ CD68+ microglia/monocytes in the nerve (Fig. 10A,B) and inner retina (Fig. 10G–I), highlighting the potential for functional complement interactions with phagocytic myeloid cells after ONI. C1q and C3 also colocalized with RGC somata (GCL) and axons (NFL) in the retina (Fig. 10J,K). C1q associated with some GFAP+ astrocytes (Fig. 10C,L) and isolectin B4+ endothelial cells (Fig. 10D,M) in the injured nerve and retina. Interestingly, we frequently observed prominent C1q immunostaining in tight rows of cells oriented parallel with the long axis of the nerve (Figs. 1, 10) that strongly colocalized with both immature/mature Olig2+ (Fig. 10E) and myelinating CC1+ (Fig. 10F) oligodendrocytes in normal optic nerves and in the distal nerve after injury. The close association of the C1q protein to oligodendrocytes, despite the absence of C1q mRNA there, suggests that functional complement-oligodendrocyte or complement-myelin interactions may exist. Together, these dynamic complement colocalization data indicate several potential functions for complement within the injured optic nerve that could affect axon regeneration.
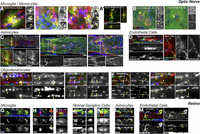
Complement proteins associate with multiple cell types after ONI. A–F, Images of immunolabeled optic nerves showing association of complement proteins with microglia/monocytes (A, red C1q, green CR3; B, green C3, red CR3), astrocytes (C, red C1q, green GFAP), endothelial cells (D, red C1q, green IB4), and oligodendrocytes (E, red C1q, green Olig2; F, red C1q, green CC1) in the naive and injured optic nerve, at and beyond the injury site. Indicated region (☐) is enlarged below. Arrowheads indicate colocalization (yellow). Double arrows indicate nearby localization. G–M, Retinal cross-sections showing association of immunolabeled complement proteins with microglia/monocytes (G, red C1q, green CR3; H, green C3, red CR3; I, red C1q, green CD68), RGCs (J, red C1q, green TUJ1; K, green C3, red TUJ1), astrocytes (L, red C1q, green GFAP), and endothelial cells (M, red C1q, green IB4) in the retina after ONI. Arrowheads indicate colocalization (yellow). Scale bars: A, B, D–M, 10 μm; C, 50 μm.
Complement-mediated phagocytosis within the optic nerve
One way in which complement-monocyte interactions might support RGC axon regeneration could be by altering the local environment of the injured nerve, perhaps through removal of growth-inhibitory myelin debris. Immunohistochemistry for CR3 and myelin protein MBP revealed an MBP-negative area that expanded with time after ONI and that closely corresponded to the dense CR3+ cell area at all time points tested (Fig. 11A). Further, confocal imaging of CR3+ cells within and at the borders of this region 14 DPI demonstrated internalized MBP+ myelin debris (Fig. 11B). The CD68 plus MBP immunostaining pattern (Fig. 11C) and internalization (Fig. 11D) were strikingly similar to that of CR3 plus MBP. These methods were validated by confirming the absence or rarity of internalized signal when the MBP antibody was as follows: (1) omitted or (2) switched with an irrelevant antibody of the same species and isotype (GFAP, TUJ1). In line with a role for myeloid cell-mediated phagocytic clearance of local myelin debris, internalized MBP+ signal was never or very rarely detected: (1) in uninjured nerves, (2) at very early time points, or (3) far from the injury site. Full-length nerve images showed that the MBP-negative area was restricted to a zone within the proximal nerve that also contained the highest density of CR3+ cells and CD68+ lysosomes (Fig. 11E). The near-absence of myelin within regions of dense monocytes at the injury site and extending distally, along with the presence of myelin debris within these cells, suggests that these lysosome-rich CR3+ monocytes phagocytose myelin debris in the injured optic nerve. Further, we confirmed that regenerating RGC axons (GAP43+ shown; also observed for CTB traced axons) grow preferentially through regions of relatively dense phagocytic myeloid cells (CD68+ cells shown; also observed for CR3+ cells) and relatively attenuated myelin debris (MBP+) 14 DPI, independent of pro-regenerative treatment (Fig. 11F; AAV2-shPTEN + oncomodulin + cAMP shown; also observed for zymosan and untreated).
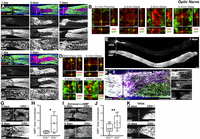
CR3+ phagocytic microglia/monocytes alter the local environment of the injured nerve. A, Representative images of optic nerves (1, 5, 7 DPI) immunolabeled for CR3 (second row, red in merged) and MBP (third row, green in merged). B, Single confocal planes with orthogonal views of MBP+ myelin debris inside CR3+ cells (14 DPI). C, Representative images of injured optic nerves (1, 5 DPI) immunolabeled for CD68 (second row, red in merged) and MBP (third row, green in merged), which strongly resemble the CR3 and MBP pattern above. D, Single confocal planes with orthogonal views of MBP inside CD68+ lysosomes (14 DPI). E, Full-length optic nerve section (7 DPI) immunolabeled for CD68 (top) and MBP (bottom) shows the MBP-negative area to be restricted to the region of the proximal nerve that contains the highest density of CD68+ lysosomes. F, Regenerating axons (GAP43+, white) are frequently associated with the area of dense phagocytic myeloid cells (CD68+, red) and attenuated myelin debris (MBP+, green). G, Images of optic nerves from CR3+/+ (top) and CR3−/− (bottom) mice 5 DPI, immunolabeled for MBP. H, Quantitative analysis indicates that CR3−/− mice have more MBP remaining near the injury site compared with littermate CR3+/+ controls. I, Images of MBP-immunolabeled optic nerves from CR3+/+ (top) and CR3−/− (bottom) mice 5 DPI with zymosan + cAMP. J, Quantitative analysis demonstrates that more MBP remains in CR3−/− mice compared with CR3+/+ controls after zymosan + cAMP treatment. K, MBP-immunolabeled optic nerves from TPEN-treated mice 14 DPI also show increased myelin in CR3−/− (bottom) vs CR3+/+ (top) nerves. Scale bars: A, C, E–G, I, K, 200 µm; B, 10 µm; D, 2 µm. Graphs represent 25th to 75th percentile (box), median (line), range (whiskers), and individual data points (circles). *p > 0.05, **p < 0.01, t test.
To test whether CR3+ cells are required for optic nerve myelin debris removal, we compared the MBP+ signal in CR3+/+ and CR3−/− mice at multiple time points and under different treatment conditions. Indeed, injured untreated optic nerves of CR3−/− mice displayed a 3.3-fold increase in MBP+ area (decrease in MBP– area) in the vicinity of the injury site compared with the nerves of CR3+/+ littermates (Fig. 11G,H; p = 0.013, t test). A similar attenuation of myelin phagocytosis was apparent in the nerves of CR3−/− (vs CR3+/+) mice both 5 d after ONI with zymosan + cAMP treatment (Fig. 11I,J; 1.8-fold MBP increase, p = 0.009, t test) and 14 d after ONI with TPEN treatment (Fig. 11K).
In summary, our examination of nerves and retinas from ONI and naive mice, with and without complement manipulation (C1q−/−, C3−/−, CR3−/−, C1q blocking antibody) and pro-regenerative treatments (zymosan + cAMP, TPEN, AAV2-shPTEN + oncomodulin + cAMP), reveals a prominent role for complement and microglia/monocytes in optic nerve regeneration and points to the nerve as the likely site of regeneration-relevant complement-myeloid cell activity.
Discussion
Myeloid cells and complement proteins play important roles in CNS injury, disease, development, and plasticity. Here, using the optic nerve as a well-characterized model in which injured CNS axons can be induced to regenerate, we systematically investigated the role of complement proteins and myeloid cells in the regenerative process. We found that complement proteins C1q and C3, along with microglia/monocytes expressing the phagocytic complement C3b receptor CR3, increase markedly in the optic nerve after injury and are required for efficient regeneration induced by three different pro-regenerative treatments. A functional comparison using local injections of a blocking antibody suggests that the critical site of complement action is within the optic nerve per se. Myelin clearance, complement proteins, and phagocytic microglia/monocytes all converge within the nerve, pointing to a critical role of the classical complement cascade and phagocytic cells in facilitating axon regeneration by removal of myelin debris.
Our parallel data from multiple pro-regenerative treatments and multiple complement manipulations after ONI demonstrate the generalizability of complement and myeloid cell dependency for RGC axon regrowth. It might be noted that the detrimental effect of deleting or blocking complement or CR3 was somewhat less pronounced when regeneration was stimulated by PTEN knockdown + oncomodulin + cAMP, although the effect did become evident further distal to the lesion. Interestingly, our transcriptomic data (Y. Yin, R. Kawaguchi, G. Coppola, D. Geschwind, L. Benowitz, personal communication) show that the Nogo receptor (NgR, RTNR4), a well-established suppressor of optic nerve regeneration (Fischer et al., 2004; Dickendesher et al., 2012; X. Wang et al., 2012) is downregulated 64% in RGCs under these conditions, possibly enabling axons to regenerate efficiently despite the presence of myelin.
In line with our findings in the mouse ONI model, C1q is also beneficial for neurite outgrowth on myelin in culture and regulates axon guidance after hemisection SCI (Peterson et al., 2015). Similarly, blockade or deletion of C5a-C5aR or C3a-C3aR signaling is detrimental to long-term locomotor recovery and histopathology after contusion SCI (Beck et al., 2010; Brennan et al., 2015, 2019). In contrast, C3 and C3b attenuate neurite outgrowth in culture, C3 deletion modestly improves regeneration in SCI models, and C1q and C3 deletion each improves locomotor recovery after contusion SCI (Galvan et al., 2008; Guo et al., 2010; Peterson et al., 2017). The shared and distinct findings in ONI, SCI, culture, PNS (Ramaglia et al., 2009), and TBI (Fluiter et al., 2014) models point to multiple functions of complement within complex and dynamic injury environments, and highlight the need for further study.
Complement C1q and C3 exert most functions through recruitment and activation of immune cells, including the CR3+/CD68+ phagocytic myeloid cells that respond robustly to ONI (Fig. 5) (Lam et al., 2009; Yungher et al., 2017; Smith et al., 2018; Liu et al., 2020). We found that pro-regenerative treatment increased, and C1q deletion decreased, CR3+ microglia/monocyte accumulation at the ONI site, and that CR3 deletion suppressed optic nerve regeneration induced by several pro-regenerative treatments. Cai et al. (2020) recently reported retinal GAP43 attenuation in CR3−/− mice following ONI, whereas Baldwin et al. (2015) found no effect of CR3 deletion on optic nerve regeneration induced by zymosan + cAMP. The reason for this discrepancy is presently unclear. Our results indicate that C3 supports regeneration through C3b binding to CR3 because CR3−/− and C3−/− mice displayed similar regeneration deficits after ONI. However, C3a and C3aR may also contribute to axon regeneration (Peterson et al., 2017; Stokowska et al., 2017).
While our data indicate that CR3+ microglia/monocytes are required for efficient optic nerve regeneration, we have not determined whether resident microglia, infiltrating monocytes, or both are involved. These cell populations have been historically difficult to distinguish, especially in CNS injury models, but the tools for investigating these questions are improving, and many groups have now reported monocyte infiltration in CNS injury and disease, including into the optic nerve in glaucoma and ONI (Paschalis et al., 2019; Williams et al., 2019; Tribble et al., 2020). Although PLX5622 eliminated nearly all CR3+ microglia in the naive optic nerve, as expected, it increased the number and staining intensity of CR3+ myeloid cells at the lesion site, suggesting enhanced monocyte infiltration into a newly vacant microglial niche (Cronk et al., 2018; Paschalis et al., 2019). This apparent CR3 compensation makes PLX5622 an unsuitable tool for manipulating the regeneration-relevant CR3+ monocytes in our model, and raises general concerns regarding the interpretation of experiments using PLX5622 or other methods to manipulate specific myeloid cell populations. Further studies that focus on the contributions of particular myeloid cell populations to axon regeneration may help identify specific therapeutic targets.
Several CNS injuries, diseases, and developmental stages are associated with elevated CNS complement levels (mRNA and protein), including ONI-induced increases in retinal C1q, C2, C4, dLGN C1q, and optic nerve C3 (Ohlsson et al., 2003; Donahue et al., 2017; Norris et al., 2018; Lee et al., 2019; Silverman et al., 2019; Borucki et al., 2020). Complement associates with neurons, including RGCs in glaucomatous, ischemia-reperfusion, and developing retina and dLGN (Stevens et al., 2007; Ding et al., 2012; Silverman et al., 2016; Bosco et al., 2018), where C1q and C3 can be neuroprotective (see Introduction), neurotoxic (Kuehn et al., 2008; Yang et al., 2013; Bosco et al., 2018), or promote synaptic pruning (see Introduction) depending on timing and context. We demonstrate C1q-C3-RGG protein colocalization in the retina after ONI and local production of C1q by retinal microglia, raising the question of whether this activity contributes to the regeneration deficit. However, we infrequently detected an RGC survival deficit in these mice (2 of 15 comparisons); and when we did, it was small (17%-20% decrease), arguing against RGC death as the primary effect of complement deletion after ONI. Other ONI studies have reported that C3 deletion does not affect RGC survival (Norris et al., 2018) (although early time point) and that C1q + IL1a + TNF is neurotoxic (Liddelow et al., 2017). Complement- and microglia-mediated RGC synaptic pruning is similarly unlikely to contribute to regeneration, as we seldom observed synaptic engulfment by retinal microglia after ONI (not shown).
Although we cannot exclude the possibility of axon growth modulation through complement-RGC, -microglia, -astrocyte, or -endothelial interactions within the retina, our characterization and functional data that take advantage of the anatomic separation inherent in the ONI model better support mechanisms within the optic nerve. This methodology and subsequent finding are consequential because many ONI studies, including those that investigate mechanisms of axon regeneration, focus exclusively on the retina as the functionally relevant site. Our study highlights the need for parallel examination of both tissues (see also Ahmed et al., 2010), suggests descriptive and manipulative methods, and narrows our focus of regeneration-relevant complement interactions to the optic nerve.
In the optic nerve, we demonstrate local production of C1q, and to a lesser extent C3, by myeloid cells at the injury site. However, the early timing, mostly acellular pattern, and location of the C3 protein accumulation suggest that additional complement likely enters the nerve from serum via ONI-induced BBB disruption. Our data do not yet establish whether the regeneration-relevant source of complement after ONI is microglia, neurons, astrocytes, infiltrating immune cells, or hepatocytes/serum, a question that might be resolved using cell type-specific complement deletion (Fonseca et al., 2017). At the protein level, we observed frequent association of C1q proteins with CR3+ and CD68+ myeloid cells and CC1+ and Olig2+ oligodendrocytes within the optic nerve, in agreement with data from other CNS models (Anderson et al., 2004; Duce et al., 2006).
Our data indicate that a key consequence of blocking the classical complement pathway is suppression of myelin clearance in the injured optic nerve. Clearance of growth-inhibitory myelin debris is a known C1q-C3b-CR3-microglia/monocyte function (Brück and Friede, 1991; Makranz et al., 2006; Kopper and Gensel, 2018) that is required for efficient PNS axon regeneration (Barrette et al., 2008). In addition, myelin can directly cleave and activate C3 (Vanguri et al., 1982; Peterson et al., 2017), and C1q can bind myelin (Johns and Bernard, 1997; Peterson et al., 2015) and opsonize directly (Galvan et al., 2012), which might amplify this pathway. We report that CD68+ CR3+ microglia/monocytes predominantly occupy the demyelinated region within and beyond the optic nerve lesion and phagocytose myelin debris, and that CR3 deletion attenuates myelin clearance. Therefore, as complement proteins and myeloid cells accumulate locally in response to ONI, they further recruit (which may involve C1q+ IB4+ endothelial cells) and activate inflammatory cells, and ultimately enhance growth inhibitory myelin removal. These findings do not preclude additional regeneration-relevant mechanisms, including removal of mature oligodendrocytes, proliferation and migration of immature oligodendrocytes, or progenitor cell differentiation (Baaklini et al., 2019; Sozmen et al., 2019; Benavente et al., 2020), or perhaps phagocytic removal of other growth inhibitors, growth factor secretion, BBB disruption, or lesion modifications.
In conclusion, our data demonstrate that complement and CR3+ myeloid cells act within the optic nerve to support RGC axon regeneration. Although further study will be required to fully understand the functions that complement proteins and myeloid cells exert in response to CNS injury, the present study provides clear initial evidence for local complement production and function within the injured optic nerve, and identifies important new players in axon regeneration.
Footnotes
- Received March 12, 2021.
- Revision received July 21, 2021.
- Accepted August 16, 2021.
-
This work was supported by the Dr. Miriam and Sheldon Adelson Medical Research Foundation to L.I.B.; National Institutes of Health 5 R01 EY027881-02 to L.I.B.; National Institute of Child Health and Human Development IDDRC HD018655 to L.I.B.; National Eye Institute MBED T32 EY007145 to S.L.P.; the Gilbert Family Foundation Vision Restoration Initiative to L.I.B., K.A.W., and S.d.L.; and the Medical Technology Enterprise Consortium to L.I.B. We thank the Boston Children's Hospital IDDRC Cellular Imaging and Viral Vector Cores and the Harvard Medical School Neurobiology Imaging Facility for assistance; Dr. Andrea Tenner, Dr. Aileen Anderson and Stacey Peterson for valuable conversations and suggestions; Josh Chartock, Nadeen Abuhassan, Tashana Watson, Andrea Catacora, and Eric Pilchowski for histological assistance; and Hui-ya Gilbert for general laboratory management, training, and assistance.
-
The authors declare no competing financial interests.
- Correspondence should be addressed to Larry I. Benowitz at Larry.Benowitz{at}childrens.harvard.edu or Sheri L. Peterson at Sheri.Peterson{at}childrens.harvard.edu
- Copyright © 2021 the authors




