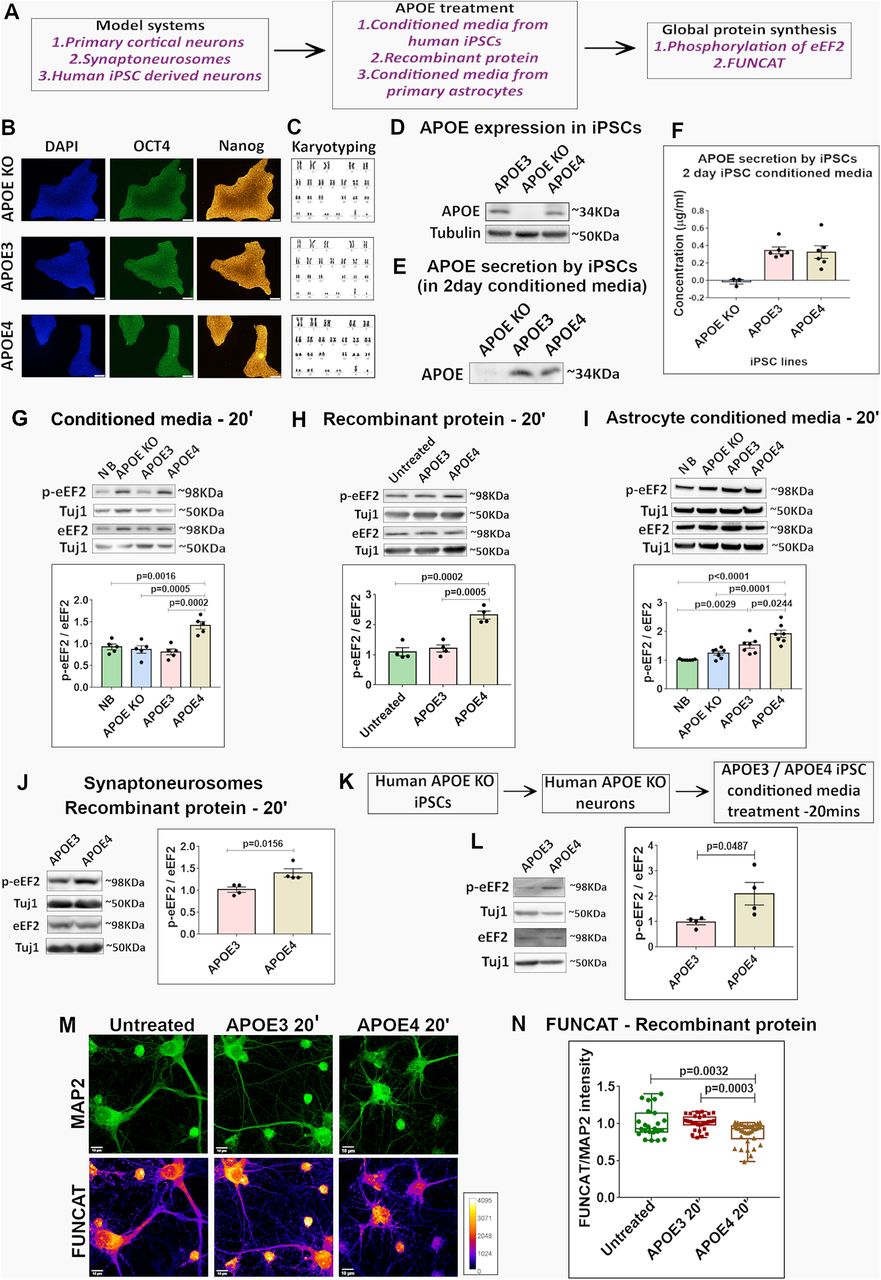
APOE4 treatment for 20 min decreases global protein synthesis in neurons and synaptoneurosomes. A, Experimental workflow. Three different model systems primary cortical neurons, synaptoneurosomes or human iPSC derived neurons were treated with APOE from different sources: stem cell-secreted APOE, astrocyte-secreted APOE, and recombinant APOE protein. The APOE-treated neurons were probed for readouts of global protein synthesis. B, APOE KO, APOE3, and APOE4 iPSCs were characterized for the expression of nuclear marker DAPI (left) and pluripotency markers OCT4 (middle) and NANOG (right). The representative images for the same are shown (scale bar: 10 μm). C, The karyotyping profile of APOE KO, APOE3, and APOE4 iPSCs. D, APOE KO, APOE3, and APOE4 iPSC cell lysates were probed for the expression of APOE. Representative immunoblots indicating the levels of APOE and loading control Tubulin are shown. E, APOE KO, APOE3, and APOE4 iPSCs, on reaching 50% confluency, were maintained in neurobasal for 48 h. Representative immunoblots indicate the APOE secreted by the iPSCs in 2-d conditioned neurobasal media. F, The amount of APOE secreted by the iPSCs in 2-d conditioned neurobasal media was estimated through ELISA. The graph indicates the average APOE concentration (µg/ml) in 2-d iPSC conditioned media. Data is represented as Mean ± SEM. G, Rat primary cortical neurons (DIV15) were treated with APOE (10–15 nm) from iPSC conditioned media for 20 min and probed for phosphorylation of eEF2. Top, Representative immunoblots indicating levels of phospho-eEF2, eEF2, and Tuj1. Bottom, Graph indicating ratio of phospho-eEF2 to eEF2 normalized to Tuj1. Data are represented as mean ± SEM, N = 5, one-way ANOVA (p = 0.0001) followed by Tukey's multiple comparison test. H, Rat primary cortical neurons (DIV15) were treated with recombinant APOE protein (15 nm) for 20 min and probed for phosphorylation of eEF2. Top, Representative immunoblots indicating levels of phospho-eEF2, eEF2, and Tuj1. Bottom, Graph indicating ratio of phospho-eEF2 to eEF2 normalized to Tuj1. Data are represented as mean ± SEM, N = 4, one-way ANOVA (p = 0.0002) followed by Tukey's multiple comparison test. I, Mouse primary cortical neurons (DIV15) were treated with APOE from mouse primary astrocyte conditioned media for 20 min and probed for phosphorylation of eEF2. Top, Representative immunoblots indicating levels of phospho-eEF2, eEF2, and Tuj1. Bottom, Graph indicating ratio of phospho-eEF2 to eEF2 normalized to Tuj1. Data are represented as mean ± SEM, N = 7, one-way ANOVA (p < 0.0001) followed by Tukey's multiple comparison test. J, Synaptoneurosomes prepared from P30 rat cortices were treated with recombinant APOE protein (15 nm) for 20 min and probed for phosphorylation of eEF2. Left, Representative immunoblots indicating levels of phospho-eEF2, eEF2, and Tuj1. Right, Graph indicating ratio of phospho-eEF2 to eEF2 normalized to Tuj1. Data are represented as mean ± SEM, N = 4, unpaired Student's t test. K, Experimental workflow. Human APOE KO neurons derived from human APOE KO iPSCs were subjected to APOE3 or APOE4 iPSC conditioned media treatment for 20 min and probed for phosphorylation of eEF2. L, Human APOE KO neurons (four weeks into neuronal maturation) were treated with APOE3/APOE4 (10–15 nm) iPSC conditioned media for 20 min and probed for the phosphorylation of eEF2. Left, Representative immunoblots indicating levels of phospho-eEF2, eEF2, and Tuj1. Right, Graph indicating ratio of phospho-eEF2 to eEF2 normalized to Tuj1. Data are represented as mean ± SEM, N = 4, unpaired Student's t test. M, Rat primary cortical neurons (DIV15) were treated with recombinant APOE protein (15 nm) for 20 min and subjected to FUNCAT along with immunostaining for MAP2. The representative images for MAP2 and FUNCAT fluorescent signal under different APOE treatment conditions are shown (scale bar: 10 μm). N, The graph represents the quantification of the FUNCAT fluorescent intensity normalized to MAP2 fluorescent intensity under different APOE treatment conditions. Each data point represents an individual neuron. N = 20–40 neurons from 4 independent experiments, one-way ANOVA (p = 0.0001) followed by Tukey's multiple comparison test.


