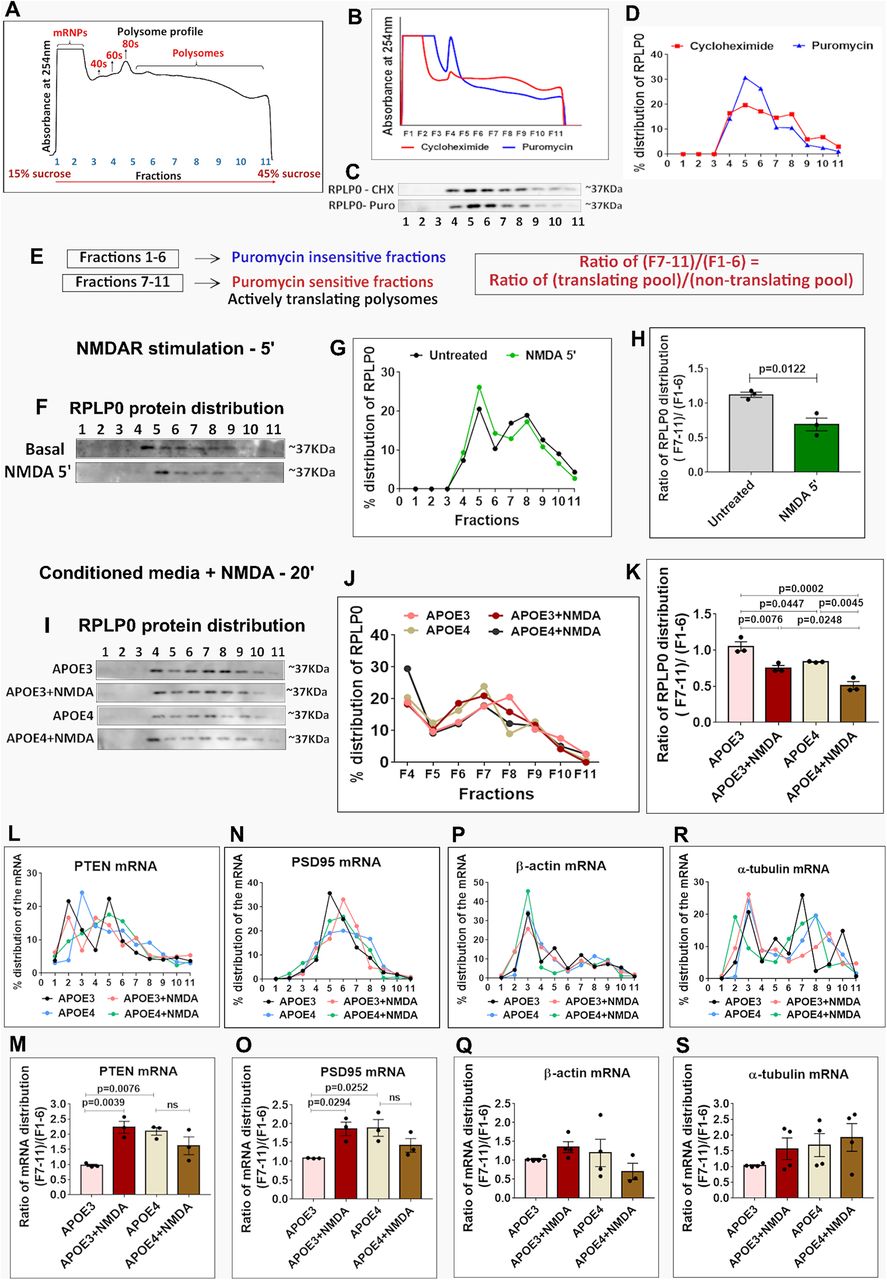
20-min treatment of neurons with APOE4 mimics the 5-min NMDAR response of global protein synthesis inhibition and translation activation of specific candidate mRNAs. A, Representative polysome profile or absorbance profile at 254 nm indicating the mRNPs, ribosomal subunits (40S, 60S), monosomes (80S), and polysomes distributed on 15–45% linear sucrose gradient. B, Rat primary cortical neurons (DIV15) were subjected to polysome profiling after treatment with Cycloheximide (CHX) and Puromycin (Puro). The graph represents the polysome profile or absorbance profile at 254 nm under CHX and Puro conditions. C, The immunoblots show the distribution of ribosomal protein RPLP0 in the individual fractions on CHX and Puro treatment conditions. D, The graph represents the percentage distribution of RPLP0 in each fraction under CHX and Puro treatment conditions. E, Schematic showing the division of polysome profiling fractions into two pools based on sensitivity to puromycin treatment. Fractions 7–11 were the puromycin sensitive or actively translating pool and fractions 1–6 were the puromycin insensitive pool or non-translating pool. The ratio of the percentage of protein or mRNA in fractions 7–11/fractions 1–6 indicates their distribution in the translating pool/non-translating pool. F, Rat primary cortical neurons (DIV15) were stimulated with 20 μm NMDA for 5 min, subjected to polysome profiling and probed for the distribution of ribosomal protein RPLP0. The immunoblots indicate the distribution of RPLP0 in the individual fractions. G, The line graph indicates the percentage distribution of RPLP0 in the individual fractions under basal and 5-min NMDA stimulated conditions. H, The graph represents the ratio of RPLP0 protein distribution in fractions 7–11 (translating pool) to fractions 1–6 (non-translating pool) under basal and 5-min NMDA stimulated conditions. Data are represented as mean ± SEM, N = 3, unpaired Student's t test. I, Rat primary cortical neurons (DIV15) were treated with APOE3/APOE4 (10–15 nm) conditioned media for 20 min along with NMDAR stimulation for 5 min (20 μm NMDA). The cell lysates were subjected to polysome profiling and probed for the distribution of ribosomal protein RPLP0. The immunoblots show the distribution of RPLP0 in the individual fractions under different treatment conditions. J, The line graph represents the percentage distribution of RPLP0 protein in fractions 4–11 under different APOE treatment conditions. K, The graph represents the ratio of RPLP0 protein distribution in fractions 7–11 (translating pool) to fractions 1–6 (non-translating pool) under different APOE treatment conditions. Data are represented as mean ± SEM, N = 3, one-way ANOVA (p = 0.0002) followed by Tukey's multiple comparison test. L, The line graph represents the percentage distribution of PTEN mRNA in each fraction under different APOE treatment conditions. M, The graph represents the ratio of PTEN mRNA distribution in fractions 7–11 (translating pool) to fractions 1–6 (non-translating pool). Data are represented as mean ± SEM, N = 3, one-way ANOVA (p = 0.006) followed by Dunnett's multiple comparison test, ns in the figure implies non-significant. N, The line graph represents the percentage distribution of PSD95 mRNA in each fraction under different APOE treatment conditions. O, The graph represents the ratio of PSD95 mRNA distribution in fractions 7–11 (translating pool) to fractions 1–6 (non-translating pool). Data are represented as mean ± SEM, N = 3, one-way ANOVA (p = 0.0286) followed by Dunnett's multiple comparison test, ns in the figure implies non-significant. P, The line graph represents the percentage distribution of β-actin mRNA in each fraction under different APOE treatment conditions. Q, The graph represents the ratio of β-actin mRNA distribution in fractions 7–11 (translating pool) to fractions 1–6 (non-translating pool). Data are represented as mean ± SEM, N = 3, one-way ANOVA (ns - non-significant). R, The line graph represents the percentage distribution of α-tubulin mRNA in each fraction under different APOE treatment conditions. S, The graph represents the ratio of α-tubulin mRNA distribution in fractions 7–11 (translating pool) to fractions 1–6 (non-translating pool). Data are represented as mean ± SEM, N = 3, one-way ANOVA (ns - non-significant).


