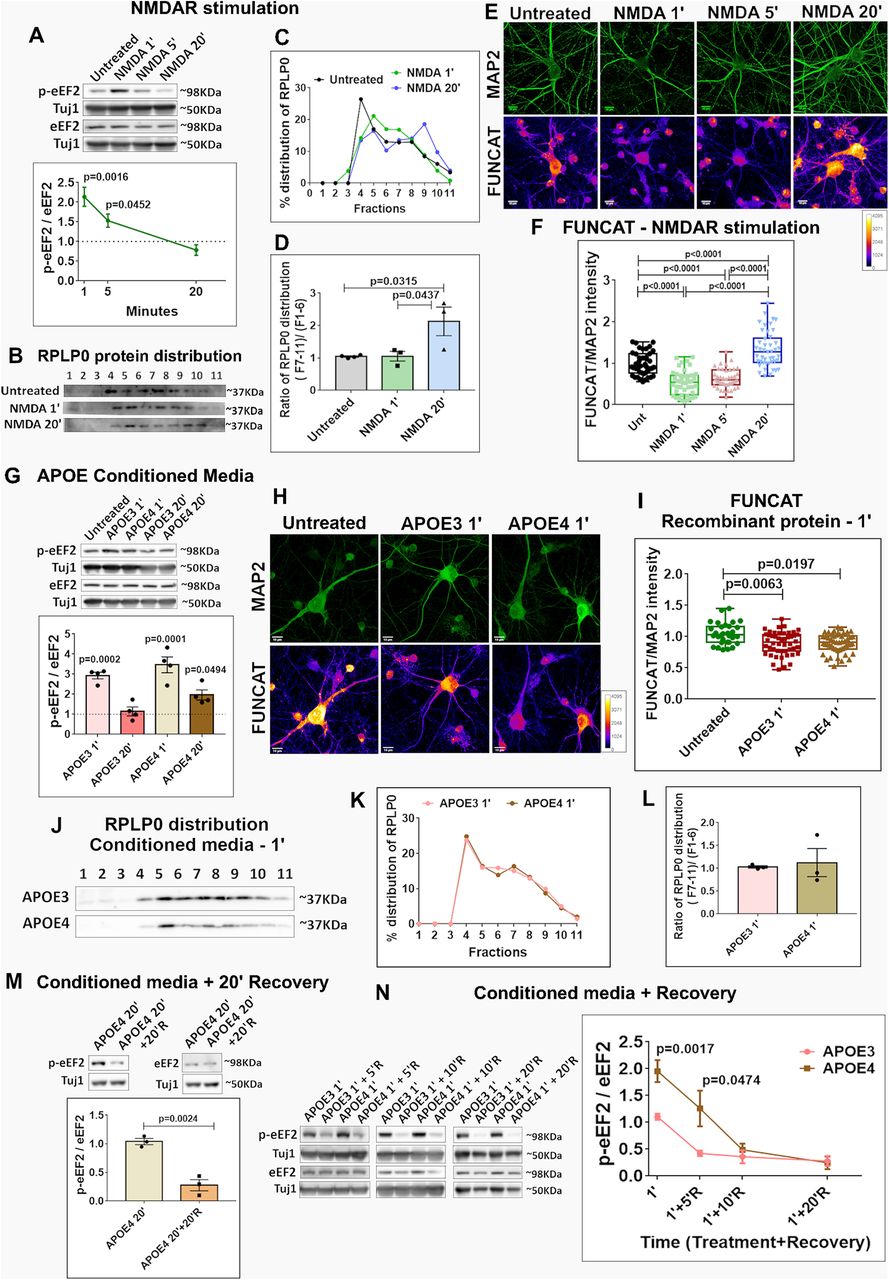
Temporal profiles of NMDA, APOE3, and APOE4 translation response. A, Rat primary cortical neurons (DIV15) were treated with NMDA (20 μm) for 1, 5, and 20 min and probed for phosphorylation of eEF2. Top, Representative immunoblots indicating levels of phospho-eEF2, eEF2, and Tuj1. Bottom, Graph indicating ratio of phospho-eEF2 to eEF2 normalized to Tuj1. Data are represented as mean ± SEM, N = 3, one-way ANOVA (p = 0.0015) followed by Tukey's multiple comparison test. B, Rat primary cortical neurons (DIV15) were stimulated with 20 μm NMDA for 1 and 20 min, subjected to polysome profiling and probed for the distribution of ribosomal protein RPLP0. The immunoblots indicate the distribution of RPLP0 in the individual fractions. C, Line graph showing the percentage distribution of RPLP0 under different NMDA stimulation conditions. D, Bar graph representing the ratio of RPLP0 protein distribution in fractions 7–11 (translating pool) to fractions 1–6 (non-translating pool) under different NMDA stimulation conditions. Data are represented as mean ± SEM, N = 3, one-way ANOVA (p = 0.0248) followed by Tukey's multiple comparison test. E, Rat primary cortical neurons (DIV15) were stimulated with NMDA (20 μm) for 1, 5, and 20 min and subjected to FUNCAT along with immunostaining for MAP2. The representative images for MAP2 and FUNCAT fluorescent signal under different treatment conditions are shown (scale bar: 10 μm). F, The graph represents the quantification of the FUNCAT fluorescent intensity normalized to MAP2 fluorescent intensity under different NMDAR stimulation time points. Each data point represents an individual neuron. N = 40–50 neurons from 3 independent experiments, one-way ANOVA (p < 0.0001) followed by Tukey's multiple comparison test. G, Rat primary cortical neurons (DIV15) were treated with APOE3/APOE4 (10–15 nm) conditioned media for 1 and 20 min and probed for the phosphorylation of eEF2. Top, Representative immunoblots indicating levels of phospho-eEF2, eEF2, and Tuj1. Bottom, Graph indicating ratio of phospho-eEF2 to eEF2 normalized to Tuj1. Data are represented as mean ± SEM. Dotted line indicates the untreated condition. All the APOE treatments were normalized to untreated condition; N = 4, one-way ANOVA (p < 0.0001) followed by Dunnett's multiple comparison test. H, Rat primary cortical neurons (DIV15) were treated with recombinant APOE protein (15 nm) for 1 min and subjected to FUNCAT along with immunostaining for MAP2. The representative images for MAP2 and FUNCAT fluorescent signal under different APOE treatment conditions are shown (scale bar: 10 μm). I, The graph represents the quantification of the FUNCAT fluorescent intensity normalized to MAP2 fluorescent intensity under different APOE treatment conditions. Each data point represents an individual neuron. N = 20–40 neurons from 4 independent experiments, one-way ANOVA (p = 0.0058) followed by Tukey's multiple comparison test. J, Rat primary cortical neurons (DIV15) were treated with APOE3/APOE4 conditioned media (10–15 nm) for 1 min, subjected to polysome profiling and probed for the distribution of ribosomal protein RPLP0. The immunoblots indicate the distribution of RPLP0 in the individual fractions. K, The line graph shows the percentage distribution of RPLP0 under different APOE treatment conditions. L, The bar graph represents the ratio of RPLP0 protein distribution in fractions 7–11 (translating pool) to fractions 1–6 (non-translating pool) under different APOE treatment conditions. Data are represented as mean ± SEM, N = 3, unpaired Student's t test (ns - non-significant). M, Rat primary cortical neurons (DIV15) were treated with APOE4 (10–15 nm) conditioned media for 20 min and subjected to recovery for 20 min using preconditioned neurobasal media. The samples were probed for the phosphorylation of eEF2. Top, Representative immunoblots indicating levels of phospho-eEF2, eEF2, and Tuj1. Bottom, Graph indicating ratio of phospho-eEF2 to eEF2 normalized to Tuj1. Data are represented as mean ± SEM, N = 3, unpaired Student's t test. N, Rat primary cortical neurons (DIV15) were treated with APOE3/APOE4 (10–15 nm) conditioned media for 1 min and subjected to recovery for 5/10/20 min using preconditioned neurobasal media, and probed for the phosphorylation of eEF2. The data from each recovery time point are normalized to its corresponding 1-min APOE-treated set. Left, Representative immunoblots indicating levels of phospho-eEF2, eEF2, and Tuj1. Right, Graph indicating ratio of phospho-eEF2 to eEF2 normalized to Tuj1. Data are represented as mean ± SEM. For APOE3 1' and APOE4 1', N = 8, unpaired Student's t test. For APOE 1' + 5'R, N = 4, unpaired Student's t test. For APOE 1' + 10'R, N = 5. For APOE 1' + 20'R, N = 3.


