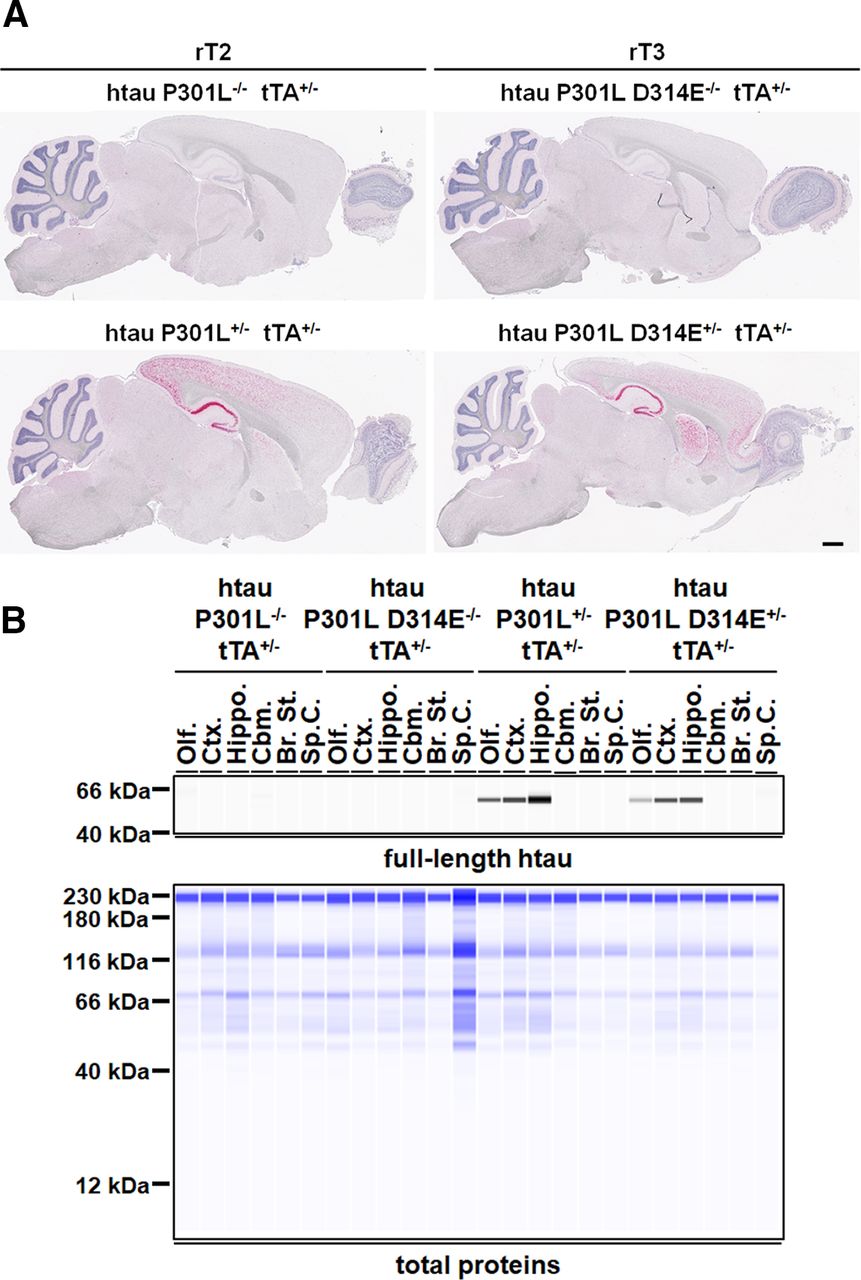
Spatial expression pattern of htau transgenes in rT2 and rT3 mice. A, Representative ISH photomicrographs showing mRNA expression of htau transgenes (indicated by red signals) in sagittal sections of 2-month-old rT2 and rT3 mice. Scale bar, 0.8 mm. B, Representative SWAWB images showing protein expression of htau transgenes in six distinct anatomic regions of the CNS of 2-month-old rT2 and rT3 mice: olfactory bulb (Olf.), cerebral cortex (Ctx.), hippocampus (Hippo.), cerebellum (Cbm.), brainstem (Br. St.), and spinal cord (Sp. C.). Top, fl-htau revealed using monoclonal htau-specific HT7 antibody. Bottom, Total brain proteins. htau P301L+/− tTA+/−, rT2 mice; htau P301L D314E+/− tTA+/−, rT3 mice; htau P301L−/− tTA+/− and htau P301L D314E−/− tTA+/−: age-matched littermates of rT2 and rT3 mice, respectively, that expressed only the tTA activator. These mice served as negative controls. The expression pattern of htau transgenes was similar in both genders, and only that of female mice is shown. kDa, kilodaltons.


