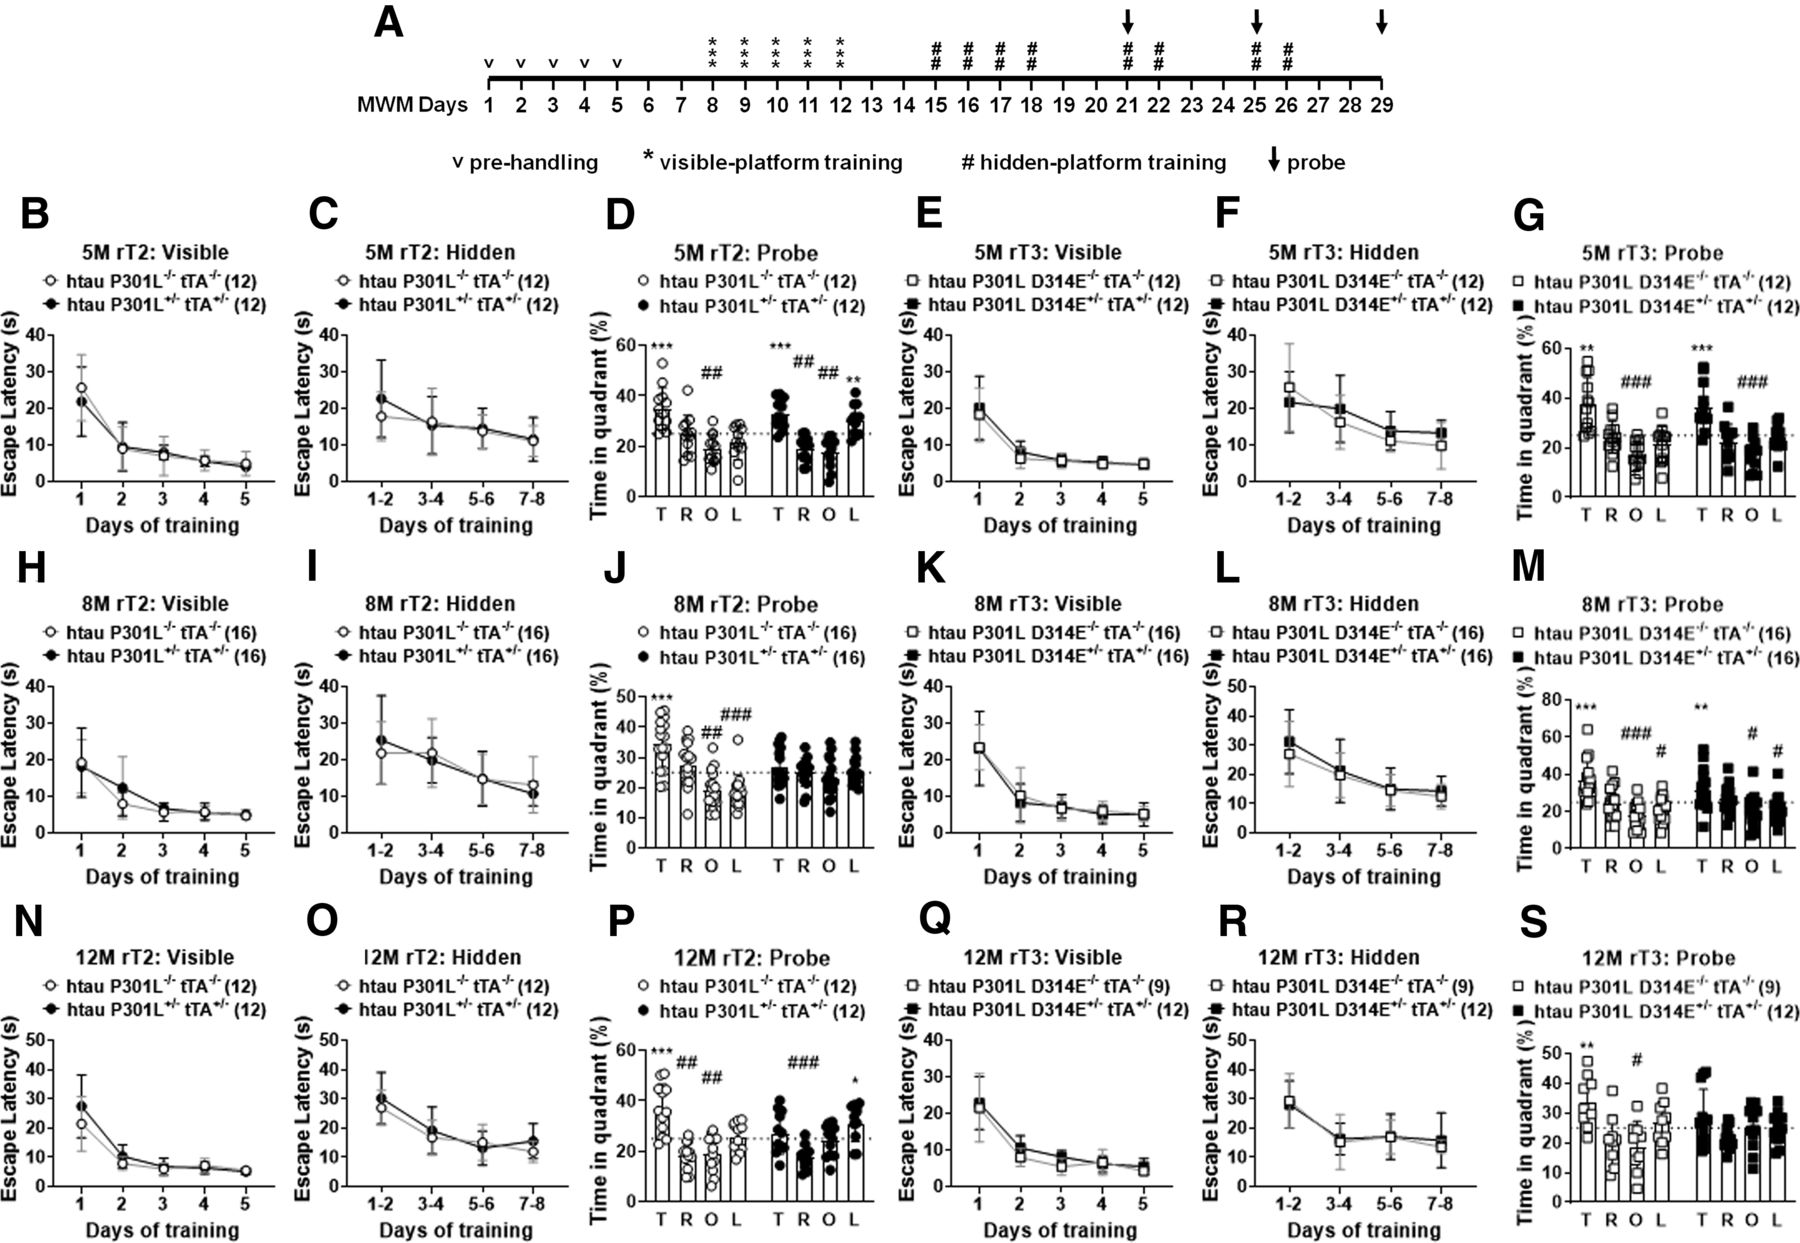
Age-related spatial reference learning and memory in rT2 and rT3 mice. A, A schematic diagram illustrating the experimental procedures of MWM used to measure spatial reference learning and memory of rT2 and rT3 mice at 5, 8, and 12 months of age. Detailed description is available in Materials and Methods. B–S, Superimposed symbols with bars (group mean ± SD) and connecting line graphs (B,C,E,F,H,I,K,L,N,O,Q,R) show data of the visible- and hidden-platform trials. Scatter plot with bar (individual data plus group mean ± SD) graphs (D,G,J,M,P,S) show data of the probe phase with the 25% chance level shown in dotted lines. Post hoc analyses following the Dirichlet distribution were performed to identify differences between each of the four quadrant occupancies and the chance level. Numbers of animals (for detailed gender distribution, see Table 1) used are shown in parentheses. *p < 0.05, **p < 0.01, ***p < 0.001 (for quadrant occupancies >25%). #p < 0.05, ##p < 0.01, ###p < 0.001 (for quadrant occupancies <25%). T, Target quadrant; R, right quadrant; O, opposite quadrant; L, left quadrant. htau P301L+/− tTA+/−, rT2 mice; htau P301L−/− tTA−/−, non-Tg littermates of rT2 mice; htau P301L D314E+/− tTA+/−, rT3 mice; htau P301L D314E−/− tTA−/−, non-Tg littermates of rT3 mice. M, months of age.


