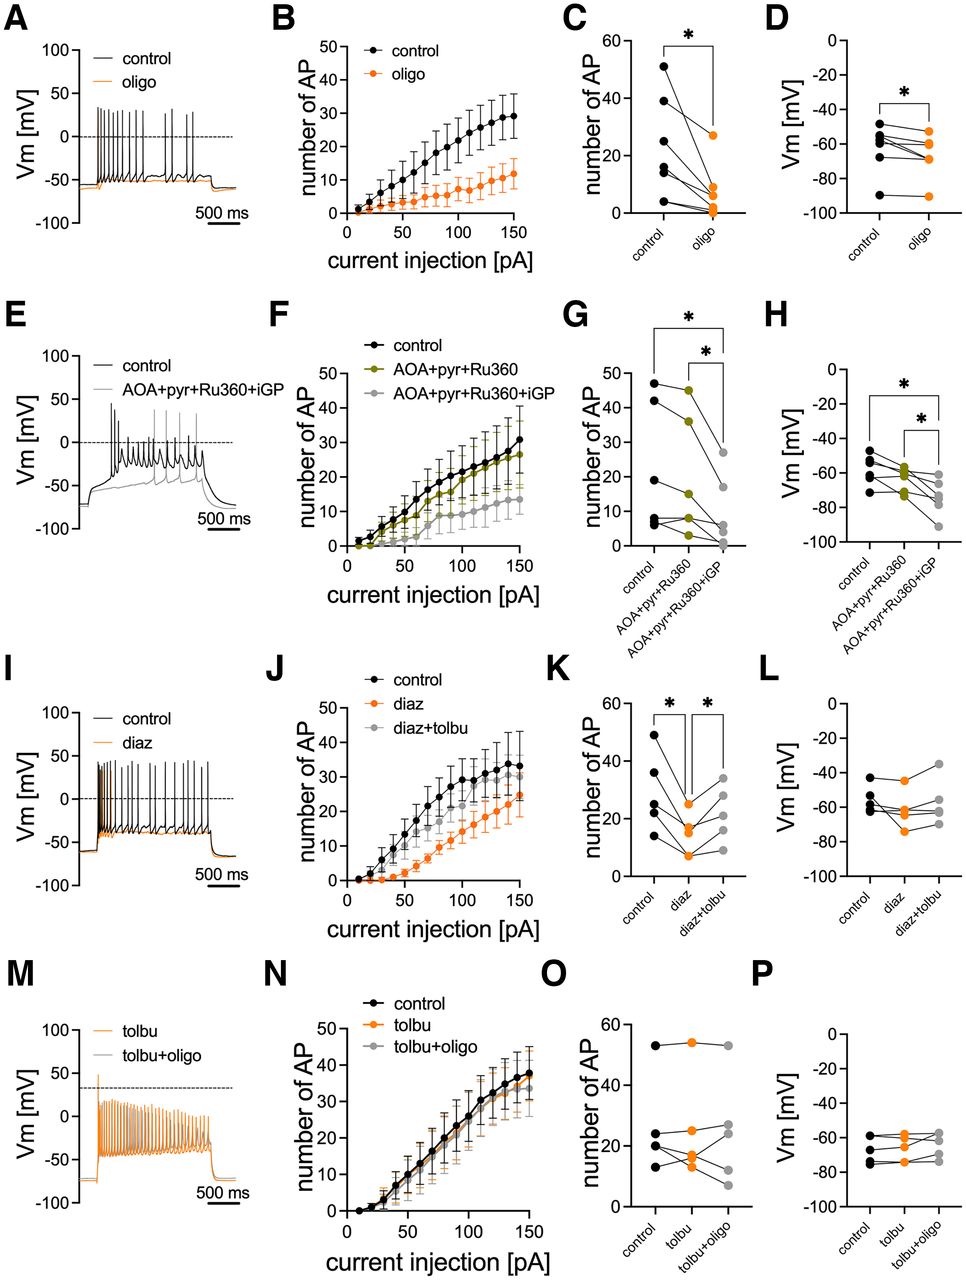
Metabolic regulation of action potential firing. Action potentials were triggered by 2 s current injections with increasing amplitudes in single neurons using the perforated patch configuration. A, Original traces with 100 pA current injection before (black trace) and during the presence of 1 μm oligomycin (orange trace). B, Number of action potentials evoked by 2 s currents with increasing amplitudes (n = 7 neurons from two independent preparations) before (black symbols) and during the presence of oligomycin (orange symbols). C, Number of action potentials evoked by 100 pA currents before (black symbols) and during the presence of oligomycin (orange symbols; same neurons as in B). D, Resting membrane potential before (black symbols) and during the presence of oligomycin (orange symbols; same neurons as in B and C). E, Original traces with 100 pA current injection before (black trace) and during the presence of 100 μm AOA + 2 mm pyr + 10 μm Ru360 + 100 μm iGP (gray trace). F, Number of action potentials evoked by 2 s currents with increasing amplitudes (n = 6 neurons from two independent preparations) before (black symbols) and during (green symbols) the presence of AOA + pyr + Ru360 + iGP (gray symbols). G, Number of action potentials evoked by 100 pA currents before (black symbols) and during (green symbols) the presence of AOA + pyr + Ru360 and after the addition of iGP (AOA + pyr + Ru360 + iGP; gray symbols; same neurons as in F). H, Resting membrane potential before (black symbols) and during (green symbols) the presence of AOA + pyr + Ru360 and after addition of iGP (AOA + pyr + Ru360 + iGP; gray symbols; same neurons as in F and G). I, Original traces with 100 pA current injection before (black trace) and during (orange trace) the presence of 300 μm diaz. J, Number of action potentials evoked by 2 s currents with increasing amplitudes (n = 5 neurons from two independent preparations) before (black symbols) and during (orange symbols) the presence of diaz and after subsequent addition 50 μm tolbutamide (diaz + tolbu; gray symbols). K, Number of action potentials evoked by 100 pA currents before (black symbols) and during (orange symbols) the presence of diaz and after addition of tolbutamide (diaz + tolbu; gray symbols; same neurons as in J). L, Resting membrane potential before (black symbols) and during (orange symbols) the presence of diaz and after addition of tolbutamide (diaz + tolbu; gray symbols; same neurons as in J and K). M, Original traces with 100 pA current injection during the presence of 50 μm tolbutamide (tolbu; orange trace) and after subsequent addition of 1 μm oligomycin (oligo; gray trace). N, Number of action potentials evoked by 2 s currents with increasing amplitudes (n = 5 neurons from two independent preparations) before (black symbols) and during (orange symbols) the presence of tolbu and after subsequent addition of 1 μm oligomycin (tolbu + oligo; gray symbols). O, Number of action potentials evoked by 100 pA currents before (black symbols) and during (orange symbols) the presence of tolbu and after addition of oligomycin (tolbu + oligo; gray symbols; same neurons as in N). P, Resting membrane potential before (black symbols) and during (orange symbols) the presence of tolbu and after addition of oligomycin (tolbu + oligo; gray symbols; same neurons as in N and O). *p < 0.05 (repeated-measures one-way ANOVA with Geisser–Greenhouse correction followed by Tukey's multiple-comparisons test).


