CSF1R-Mediated Myeloid Cell Depletion Prolongs Lifespan But Aggravates Distinct Motor Symptoms in a Model of Multiple System Atrophy
- Kristina Battis1,
- Jazmin B. Florio2,
- Michael Mante2,
- Addison Lana3,
- Isabel Naumann1,
- Carina Gauer1,
- Vera Lambrecht1,5,
- Simon Julian Müller1,
- Isidoro Cobo3,
- Bethany Fixsen3,
- Ha Yeon Kim2,
- Eliezer Masliah4,
- Christopher K. Glass3,
- Johannes C. M. Schlachetzki3,
- Robert A. Rissman2,
- Jürgen Winkler1,5, and
- Alana Hoffmann1
- 1Department of Molecular Neurology, University Hospital Erlangen, Friedrich-Alexander-Universität Erlangen-Nürnberg, Erlangen, 91054, Germany
- 2Department of Neurosciences, University of California-San Diego, La Jolla, California 92093
- 3Department of Cellular and Molecular Medicine, University of California-San Diego, La Jolla, California 92093
- 4Division of Neuroscience, National Institute on Aging, National Institutes of Health, Bethesda, Maryland 20892
- 5Center of Rare Diseases Erlangen (ZSEER), University Hospital Erlangen, Friedrich-Alexander-Universität Erlangen-Nürnberg, Erlangen, 91054, Germany
-
Author contributions: K.B., J.B.F., M.M., A.L., I.N., C. Gauer, V.L., S.J.M., I.C., B.F., H.Y.K., J.C.M.S., R.A.R., J.W., and A.H. performed research; K.B., I.N., C. Gauer, V.L., S.J.M., H.Y.K., C.K. Glass, J.C.M.S., R.A.R., J.W., and A.H. analyzed data; K.B., J.C.M.S., and A.H. wrote the first draft of the paper; K.B., J.B.F., A.L., I.N., C. Gauer, V.L., S.J.M., I.C., B.F., H.Y.K., E.M., C.K. Glass, J.C.M.S., R.A.R., J.W., and A.H. edited the paper; K.B., J.C.M.S., and A.H. wrote the paper; I.C., B.F., H.Y.K., E.M., C.K. Glass, J.C.M.S., and R.A.R. contributed unpublished reagents/analytic tools; J.C.M.S., J.W., and A.H. designed research.
Abstract
As the CNS-resident macrophages and member of the myeloid lineage, microglia fulfill manifold functions important for brain development and homeostasis. In the context of neurodegenerative diseases, they have been implicated in degenerative and regenerative processes. The discovery of distinct activation patterns, including increased phagocytosis, indicated a damaging role of myeloid cells in multiple system atrophy (MSA), a devastating, rapidly progressing atypical parkinsonian disorder. Here, we analyzed the gene expression profile of microglia in a mouse model of MSA (MBP29-hα-syn) and identified a disease-associated expression profile and upregulation of the colony-stimulating factor 1 (Csf1). Thus, we hypothesized that CSF1 receptor-mediated depletion of myeloid cells using PLX5622 modifies the disease progression and neuropathological phenotype in this mouse model. Intriguingly, sex-balanced analysis of myeloid cell depletion in MBP29-hα-syn mice revealed a two-faced outcome comprising an improved survival rate accompanied by a delayed onset of neurological symptoms in contrast to severely impaired motor functions. Furthermore, PLX5622 reversed gene expression profiles related to myeloid cell activation but reduced gene expression associated with transsynaptic signaling and signal release. While transcriptional changes were accompanied by a reduction of dopaminergic neurons in the SNpc, striatal neuritic density was increased upon myeloid cell depletion in MBP29-hα-syn mice. Together, our findings provide insight into the complex, two-faced role of myeloid cells in the context of MSA emphasizing the importance to carefully balance the beneficial and adverse effects of CSF1R inhibition in different models of neurodegenerative disorders before its clinical translation.
SIGNIFICANCE STATEMENT Myeloid cells have been implicated as detrimental in the disease pathogenesis of multiple system atrophy. However, long-term CSF1R-dependent depletion of these cells in a mouse model of multiple system atrophy demonstrates a two-faced effect involving an improved survival associated with a delayed onset of disease and reduced inflammation which was contrasted by severely impaired motor functions, synaptic signaling, and neuronal circuitries. Thus, this study unraveled a complex role of myeloid cells in multiple system atrophy, which indicates important functions beyond the previously described disease-associated, destructive phenotype and emphasized the need of further investigation to carefully and individually fine-tune immunologic processes in different neurodegenerative diseases.
- colony-stimulating factor 1 receptor
- motor function
- multiple system atrophy
- myeloid cells
- neuron–microglia interaction
- PLX5622
Introduction
Multiple system atrophy (MSA) is a rare atypical parkinsonian disorder with a rapid progression. Patients commonly present severe autonomic dysfunctions, motor symptoms including parkinsonism or ataxia, as well as poor levodopa responsiveness (Quinn, 1989; Krismer and Wenning, 2017). While the median survival is <10 years from disease onset (Low et al., 2015), no causal therapy is available (Eschlbock et al., 2016). Major hallmarks of MSA include accumulation of α-synuclein (α-syn) within oligodendroglial cytoplasmic inclusions (Papp et al., 1989; Dickson et al., 1999), leading to oligodendrocyte dysfunction and consequently to a profound myelin deficit (Matsuo et al., 1998), neuronal loss (Koga and Dickson, 2018), and a severe, white matter-specific immune response of myeloid cells, predominantly microglia (Ishizawa et al., 2004; Song et al., 2009; Hoffmann et al., 2019).
Microglia are the resident macrophages of the brain parenchyma. They represent the majority of the innate immune compartment in the CNS (Mrdjen et al., 2018), surveying their microenvironment and functioning as the primary immune cell defense (Davalos et al., 2005; Nimmerjahn et al., 2005). Ablation of microglia during development highlighted their importance because of their contribution to synaptic pruning, formation of neuronal circuitry and survival, as well as neurogenesis (Nayak et al., 2014). In the presence of noxious stimuli, such as cellular debris or pathogenic protein aggregates including α-syn, they are able to respond rapidly via phagocytosis and release of pro-inflammatory factors (Prinz et al., 2011). However, their responses may transform into a chronic inflammatory state, thereby severely damaging local neuronal circuitries (Rice et al., 2015).
Thus, targeting inflammatory processes and altering microglia or myeloid cell responses is a promising target for neurodegenerative disease (Han et al., 2022). Since the survival of myeloid cells depends on colony-stimulating factor 1 receptor (CSF1R) signaling (Stanley and Chitu, 2014), small molecule inhibitors, such as PLX5622, have been used to deplete myeloid lineage cells in mouse models for Alzheimer's disease (AD) (3xTg-AD, 5xFAD) (Dagher et al., 2015; Spangenberg et al., 2019). PLX5622 is orally available, binds highly selectively to the CSF1R, and crosses the blood–brain barrier. By blocking the tyrosine kinase activity of the CSF1R, PLX5622 interferes with proliferation and maturation of myeloid cells, including microglia, other tissue-resident macrophages, and monocytes resulting in a profound depletion (Spangenberg et al., 2019). Thereby, PLX5622 administration prevented neuronal loss, reduced amyloid pathology, and improved cognitive behavior in mouse models of AD (Dagher et al., 2015; Spangenberg et al., 2019). Thus, CSF1R inhibition may represent a promising approach to study the role of myeloid cells in neurodegenerative processes and the potential restorative effects of myeloid cell depletion.
To analyze underlying mechanisms of MSA, we used a transgenic mouse model overexpressing human α-syn under the control of an oligodendrocyte-specific myelin basic protein (MBP) promoter (MBP29-hα-syn mice) (Shults et al., 2005). These mice develop a severe behavioral phenotype including motor symptoms at the age of 2-3 months and die prematurely at the age of 4-6 months (Shults et al., 2005; Meszaros et al., 2021). Furthermore, they present major neuropathological characteristics, such as intraoligodendroglial α-syn accumulation associated with early and severe myeloid cell activation, myelin deficit, and neuronal loss (Shults et al., 2005; Hoffmann et al., 2019). In the present study, we analyzed the gene transcripts of sorted CD11b+CD45low microglia derived from the forebrain of MBP29-hα-syn mice and identified a disease-associated gene expression profile with increased expression of Csf1 mRNA, which encodes one ligand of the CSF1R. Therefore, we investigated the effect of myeloid cell depletion on the pathogenesis of MSA by administration of PLX5622 for 3 and 12 weeks, respectively. We recorded the survival of mice, the onset of symptoms, and their motor behavior using beam walking, pole, and RotaRod test. Furthermore, we performed structural, biochemical, and gene expression analysis to define myeloid cell function in this MSA model. Notably, this study highlights the two-faced outcome of the CSF1R-mediated depletion of myeloid cells in the context of an oligodendroglial synucleinopathy.
Materials and Methods
Mice
Heterozygous MBP29-hα-syn mice and nontransgenic WT littermates (hybrid background strain: B6D2F1) were maintained under standard animal housing conditions with a 12 h dark-light cycle and access to food and water ad libitum (Gow et al., 1992; Shults et al., 2005). Mice were deeply anesthetized with an intramuscular injection of a stock anesthetic cocktail solution containing ketamine (100 mg/kg)/xylazine (10 mg/kg). Afterward, mice were checked for lack of response to tail or toe pinch. Once deeply anesthetized, the mice were transcardially perfused with 0.9% sodium chloride solution. All rodent experiments complied with National Institute of Health guidelines for good animal care and use, and all procedures were reviewed and approved by the University of California-San Diego Institutional Animal Care and Use Committee. The numbers of animals and their respective sex are summarized in Table 1.
Number of animals used within the experimental paradigm
PLX5622 administration
PLX5622 was provided by Plexxikon. The compound was formulated at 1200 mg/kg in AIN-76A standard chow provided by Research Diets Inc. Mice were fed with PLX5622 containing or control standard AIN-76A chow beginning at 4 weeks of age for a period of 3 or 12 weeks (see Figs. 2–6).
BrdU labeling
BrdU (Sigma-Aldrich, #B5002) was dissolved in saline (42°C) and administered by intraperitoneal injection with a final concentration of 50 mg/kg body weight once daily on 5 consecutive days before perfusion.
Behavioral analysis
Behavioral analysis was conducted of at least 23 animals per group (sex-matched).
Beam walking test
To assess impaired gait and balance, the beam walking test was performed as previously described (Goldstein and Davis, 1990). The animals had to travel along a horizontal round beam with a length of 1 m and a diameter of 1.3 cm. The mice received three trainings using a beam with a diameter of 2.5 cm and three test trials on the same day. One trial was completed when the animal reached the platform at the end of the beam or 1 min expired. The number of foot slips (number of slips), the total forward distance, and time traversing the beam were recorded. For scoring the performance, animals performed well when they finished all trials without any problems. When animals fell off in one or two trials, the trial was classified as intermediate. Animals that immediately fell off the beam in all trials or animals that were unable to grab the beam failed the task.
Pole test
To assess motor behavior, a pole test was performed according to Matsuura et al. (1997). The animal was placed upwards on a wooden vertical pole (50 cm long, 1 cm diameter). The time was measured to descend the pole (total time). The total time to descend was further defined as the time the animal needed until it turned (time to turn around) and the time to descend head-downward (time downward). One trial was completed when the animal placed all four paws on the ground or 2 min expired. The mice received three trainings and five test trials on the same day. Between the trials the animals were allowed to rest for 2 min. Animal performance was scored after finishing all trials, disturbances or problems within 1-4 trials were defined as intermediate. When the animal fell off the pole, was unable to grab the pole or was sliding down the pole instead of climbing, the trial was defined as failed.
RotaRod analysis
RotaRod analysis was performed according to Jones and Roberts (1968). The animal was placed on a horizontal rotating rod with an accelerating speed from 0 to 40 rpm/min within 4 min. The time was measured until the animal fell off the rod (latency to fall). Seven trials were measured, and the latency to fall was calculated for each trial. On the day before the test trials, animals performed a training of 5 trials with a speed acceleration to 10, 20, and 40 rpm/min for 4 min.
Scoring of dystonia-like behavior
Starting with 10-12 weeks of age, MBP29-hα-syn mice show sporadic dystonic episodes in response to sensory stimuli or movements (e.g. animal handling). These episodes last only a few seconds followed by complete recovery of the animal. Dystonia-like behavior has been scored weekly starting at 6 weeks of treatment (with the age of 10 weeks). The scoring method is based on the presence or absence of the episodes on opening the cage and handling the animal.
Tissue processing
For free-floating histologic analysis, one hemisphere was postfixed in 4% PFA overnight and afterward transferred into 30% sucrose overnight and coronally sectioned (40 µm).
For protein analysis, the cortex, the corpus callosum, and the striatum of the second hemisphere were dissected and homogenized using a RIPA buffer (50 mm Tris-HCl, pH 8.0, 150 mm NaCl, 2 mm EDTA, 1% v/v Nonidet P-40, 0.5% v/v Na-deoxycholate, 0.1% w/v SDS) complemented with protease and phosphatase inhibitor (Roche).
Histology
For immunohistochemistry, free-floating sections were incubated in citrate buffer (0.1 m) for antigen retrieval for 30 min at 80°C in a water bath. Afterwards, sections cooled down at room temperature (RT) for 20 min and rinsed in TBS (0.15 m NaCl, 0.1 m Tris-HCl, pH 7.5). Intrinsic peroxidase was blocked by incubation in 0.6% H2O2 in TBS for 60 min and rinsed in TBS. Subsequently, unspecific antibody-binding was blocked using 0.3% Triton X-100 and 3% donkey serum in TBS for 1 h followed by incubation with primary antibodies in blocking solution overnight at 4°C (Table 2). Biotinylated secondary antibody incubation was performed at RT for 1 h in blocking solution (Table 3). After rinsing in TBS, avidin-biotin-peroxidase complex (Vectastain Elite, Vector Laboratories) was added for 1 h, followed by peroxidase detection (25 mg/ml DAB, 0.01% H2O2 in TBS). Sections were mounted on glass slides using NeoMount (Merck).
Primary antibodies used for immunohistochemistry, Western blot, and FACS
Secondary antibodies used for immunohistochemistry and Western blot
For Sudan black staining sections were washed once with dH2O and subsequently dehydrated with increasing ethanol series (20%-70%, 4 min each). Sections were stained in Sudan black staining solution (1% Sudan black in 70% ethanol) for 5 min and washed 2 times for 1 min in 70% ethanol. Rehydration was achieved by a decreasing ethanol series (70%-20%, 3 min each). Afterward, sections were washed once with dH2O and subsequently mounted on glass slides using Aqueous Mount (Zytomed Systems) (Aescht et al., 2010).
For Heidenhain Woelcke myelin staining, free-floating sections were processed using a modified version of the previously described protocol by Hutchins and Weber (1983). Before staining, sections were incubated in 2.5% ferric ammonium sulfate for 1 h and afterward briefly rinsed in dH2O. Subsequently, sections were transferred into hematoxylin staining solution (1% hematoxylin, 20% lithium carbonate) for 1 h before excess staining was removed by washing with dH2O. Finally, sections were mounted on glass slides using Neo-mount (Merck Millipore).
For immunofluorescence, free-floating sections were treated with citrate buffer and blocking solution as described above. Consecutively, a combination of primary antibodies (Table 2) was applied in blocking solution overnight at 4°C. Rinsing in TBS was followed by incubation with respective secondary antibodies (Table 3) for 1 h at RT. Nuclei were visualized by incubation with DAPI at RT for 10 min (Sigma, 1:10,000). For BrdU staining, slices were incubated in 2N HCl at 37°C for 15 min. Afterward, sections were rinsed in 0.1 m borate buffer, pH 8.5, and subsequently washed with PBS 3 times for 10 min. Blocking was performed using PBS with 3% donkey serum and 0.25% Triton X-100 for 2 h. Primary anti-BrdU antibody was incubated overnight at 4°C in blocking solution. The next day, sections were first rinsed in PBS and afterward in blocking solution for 30 min at RT. Consecutively, secondary antibody was applied in blocking solution for 2 h at RT. After final washing with TBS or PBS (BrdU), sections were mounted on glass slides and covered with Prolong (Invitrogen).
Image acquisition and analysis
If not stated otherwise, three different regions of three consecutive coronal sections per animal were analyzed. Four images per region were taken of the M1 and M2 motor cortex (here referred to as cortex), the corpus callosum, and the striatum. For GFAP analysis, three images per region were captured. TH staining was analyzed within the striatum and the substantia nigra pars compacta (SNpc) by quantifying 2 ± 1 sections per animal.
DAB staining of ionized calcium-binding adapter molecule 1 (IBA1) and TH was imaged using an Axio Zeiss imager M2. IBA1 was captured at a lower (20×) and a higher magnification (40×), while TH was imaged at 20×. Positive cells were quantified manually in respective brain regions using the Stereo Investigator software (MBF Bioscience). Overview images of whole coronal sections stained with Sudan black and Heidenhain Woelcke myelin staining were acquired using a 10× objective and an Axio Zeiss imager M2 by analyzing the optical density using the ImageJ 2.1.0/1.53c software (Schindelin et al., 2012). α-syn expression in distinct brain regions was analyzed by performing Z stacks with a 40× objective with an Axio Observer Z1 followed by maximum intensity projection analysis using the ZEN software (Zeiss). Mean gray value was measured using ImageJ 2.1.0/1.53c. In brief, images were converted to 8-bit images, and the respective ROIs were outlined manually. Mean gray values of ROIs were determined and normalized by subtracting the background gray value of each image. OLIG2 (40× objective) and PU.1/BrdU (20× objective) labeled sections were imaged performing Z stacks using an Axio Zeiss Observer Z1. OLIG2+ and PU.1+/BrdU+ cells were quantified manually using the Cell Counter Plugin of ImageJ 2.1.0/1.53c (Schindelin et al., 2012).
The morphology of IBA1+ cells in the striatum was analyzed by performing Z stacks with a 63× objective with an Axio Observer Z1 using the ZEN software (Zeiss). For analysis of the morphology, including dendrite length, branch depths, branching level, and process arborization (using Sholl analysis), the filament tracer module of Imaris 9.2.1 was used. In total, 12 IBA1+ cells were analyzed per condition (three per animal, n = 4).
GFAP expression in distinct brain regions was analyzed by performing Z stacks with a 63× objective with an Axio Observer Z1 followed by maximum intensity projection analysis using the ZEN software (Zeiss). GFAP-positive area was measured using ImageJ 2.1.0/1.53c. First, images were converted to 8-bit images, and the respective ROI was outlined manually. Afterwards, a threshold was set using the Otsu auto-threshold method, and the percentage of area covered by GFAP was measured.
For the quantification of TH+ fibers on immunofluorescence staining, images were captured using a 40× objective at a Zeiss LSM 780 confocal scanning laser microscope. To determine the density of TH+ fibers, confocal images of TH+ neurites in the striatum were processed in ImageJ using a prewritten macro for automated fiber quantification (Extended Data Fig. 5-1 and macros below). Briefly, images were first converted to 8-bit images, and a threshold was set using the Otsu auto-threshold method. The Otsu thresholding algorithm determines the optimal threshold for binarizing an image by maximizing the interclass variance and minimizing the intraclass variance of the intensity values in the individual histogram (Otsu, 1979; Kneynsberg et al., 2016). The percentage of area covered by fibers was measured using ImageJ. In addition, the total fiber length was determined using the “Skeletonize (2D/3D)” plugin in ImageJ. This plugin extracts the skeleton of a binary image, which is further analyzed using the “Analyze Skeleton (2D/3D)” plugin. The branch length of objects >2 µm was summarized to determine the total branch length in each image (Stemick et al., 2020).
Macro used to measure TH+ pixels/area (%)
input = getDirectory(“enter dataset”);
output = getDirectory(“enter desired output directory”);
suffix = “.tif”;
processFolder(input);
function processFolder(input) {
list = getFileList(input);
for (i = 0; i < list.length; i++) {
if(File.isDirectory(input + list[i]))
processFolder(““ + input + list[i]);
if(endsWith(list[i], suffix))
processFile(input, output, list[i]);
}
}
setBatchMode(true);
function processFile (input, output, file)
open(input + file);
run(“Set Scale…”, “distance = 96 known = 20 pixel = 1 unit = µm global”);
run(“8-bit”);
run(“Auto Threshold,” “method = Otsu white”);run(“Measure”);
print(“Processing: “ + input + file);
print(“Saving to: “ + output);
}
close(“*”)
selectWindow(“Results”)
Macro used to analyze TH+ fiber length
input = getDirectory(“enter dataset”);
output = getDirectory(“enter desired output directory”);
suffix = “.tif”;
processFolder(input);
function processFolder(input) {
list = getFileList(input);
for (i = 0; i < list.length; i++) {
if(File.isDirectory(input + list[i]))
processFolder(““ + input + list[i]);
if(endsWith(list[i], suffix))
processFile(input, output, list[i]);
}
}
setBatchMode(true);
function processFile (input, output, file) {
open(input + file);
run(“Set Scale…”, “distance = 96 known = 20 pixel = 1 unit = µm global”);
run(“8-bit”);
run(“Auto Threshold,” “method = Otsu white”);
run(“Skeletonize (2D/3D)”);
run(“Analyze Skeleton (2D/3D)”, “prune = none show”);
Table.sort(“Branch length”);
print(“Processing: “ + input + file);
print(“Saving to: “ + output);
}
close(“*”)
selectWindow(“Branch information”)
saveAs(“Results,” “enter desired folder for data storage”);
Western blot
Protein concentration was measured using a bicinchoninic acid assay (Pierce BCA Protein Assay Kit, Thermo Fisher Scientific) and Clariostar Microplate Reader (562 nm) for measurement. Total protein (5-10 µg) was separated on 4%-12% Bis-Tris gels (NP0322BOX, Invitrogen) and blotted onto a PVDF membrane for fluorescence applications (PVDF-FL, IPFL 00,010, Millipore). Before blotting, membranes were activated briefly with methanol. For α-syn detection, membranes were fixed using 4% PFA at RT for 30 min and rinsed 3 times in TBS/0.1% Tween-20. Afterwards, blocking of unspecific antibody binding was performed using 1% BSA (w/v) for 1 h at RT followed by primary antibody incubation at 4°C overnight (Table 2). Membranes were rinsed with TBS/0.1% Tween-20 followed by incubation with respective fluorophore-labeled secondary antibodies for 1 h at RT (Table 3). Protein bands were visualized and analyzed using FusionFX7 (Peqlab) and the Bio1D software (Vilber Lourmat).
Microglia isolation
MBP29-hα-syn and WT mice that were 16 weeks old were anesthetized with an intramuscular injection of a stock anesthetic cocktail solution containing ketamine (100 mg/kg)/xylazine (10 mg/kg) and perfused intracardially with 0.9% sodium chloride solution. Afterwards, forebrains were removed and gently homogenized mechanically on ice in staining buffer (1× HBSS, Invitrogen, 14175-095, 0.5% BSA, and 1 mm EDTA) using a 2 ml polytetrafluoroethylene pestle (Wheaton, 358026), first in a 14 ml round-bottom tube (BD Falcon, 352059) and further in a 2 ml glass mortar (Wheaton 358004). Homogenates were filtered onto a 70 μm cell strainer (BD Falcon 352350) and centrifuged at 400 × g for 10 min. The pellet was resuspended in 6 ml 37% isotonic Percoll (Sigma, P4937). After underlaying the pellet with 5 ml of 70% isotonic Percoll in a 15 ml centrifuge tube (Corning, 430790), the tubes were centrifuged at 600 × g for 40 min at 16°C-18°C, without acceleration or deceleration. Cells of interest at the 37%-70% Percoll interphase were recovered and washed once in 15 ml HBSS before flow cytometry or FACS.
Flow cytometry and FACS analysis
Isolated microglia were first incubated in 200 µl staining buffer on ice with CD16/CD32 blocking antibody (eBioscience, 14-0161-82) for 15 min; ∼5% of cells were taken for unstained control. The remaining cells were stained with anti-mouse CD11b-APC (clone M1/70) and CD45-A488 (clone 30-F11) antibodies for 30 min (Table 2). DAPI (1:5000) was used to visualize dead cells. After washing with PBS, cells were centrifuged at 300 × g for 5 min. The pellet was then resuspended in 500-1000 µl staining buffer. Sorting of microglia from forebrains of 16-week-old animals was performed on a BD Influx cell sorter. Microglia were defined as singlets, CD11b+CD45low events, which encompassed >95% of all CD11b+ events. Raw data were processed using FlowJo software. The gating strategy is provided in Extended Data Figure 1-1. Isolated microglia were then pelleted and stored at −80°C until start of RNA isolation.
RNA isolation
For RNA isolation from three archived brain regions (corpus callosum, cortex, and striatum; n = 3 per brain region) after 12 weeks of MBP29-hα-syn and WT mice with PLX5622 or control, frozen samples were placed in 350 µl TRIzol (Invitrogen, 15596018). Samples were homogenized using Kontes cordless motor (VWR, KT749540-0000) with Kontes RNase-free pellet pestle grinders for 1.5 ml microtubes (VWR, KT-749521-1590). The lysate was then centrifuged for 5 min at 500 × g at 4°C-10°C, and the supernatant was transferred to new tubes. Total RNA from both microglia and bulk brain regions was extracted using the Direct-zol RNA MicroPrep Kit (Zymo Research, R2062) and stored at −80°C until RNA-seq cDNA libraries preparation.
RNA sequencing
Poly(A) selection of RNA was performed as previously described by Gosselin et al. (2014). Briefly, RNA samples were incubated with Oligo d(T) Magnetic Beads (NEB, S1419S), and poly(A) enriched RNA was collected. To fragment poly(A) RNA, samples were incubated at 94°C for 9 min on beads in 2× Superscript III first-strand buffer with 10 mm DTT (Thermo Fisher Scientific).
Next, RNA in 2× SuperScript III (Invitrogen, catalog 18080-044) buffer was incubated for 1 min at 50°C on a PCR cycler with 2.5 µl of the following mix: 1.5 µg Random Primer (Invitrogen 48190-011), 10 μm Oligo d(T) (Invitrogen 18418020), 10 units SUPERase-In (Ambion AM2696), 4 mm dNTP mix (Invitrogen 18427088), in dH2O. Samples were then immediately placed on ice for 5 min. First-strand synthesis was performed by incubation at 25°C for 10 min and 50°C for 50 min on a PCR cycler with 7.6 µl of the following mix: 0.2 µg actinomycin (Sigma A1410), 13.15 mm DTT (Invitrogen), 0.026% Tween-20, 100 units SuperScript III, in dH2O. After incubation, RNA/DNA complexes were isolated by adding 36 µl of Agencourt RNAClean XP beads (Beckman Coulter A63987) and incubated for 10 min at RT and 10 min on ice. Samples were placed on a magnet, and beads were washed twice with 150 µl of 75% ethanol. Following washing, beads were air-dried for 10-12 min and eluted with 10 µl of dH2O.
Afterwards, second-strand synthesis was performed. RNA/DNA samples in 10 µl dH2O were incubated for 2.5 h at 16°C with 5 µl of the following mix: 3× Blue Buffer (Enzymatics), 1.0 µl PCR mix (Affymetrix 77330), 2.0 mm dUTP (Affymetrix 77206), 1 unit RNAseH (Ezymatics Y9220L), 10 units DNA Polymerase I (Enzymatics P7050L), 0.03% Tween-20, in dH2O. DNA was then purified by addition of 1.5 µl Sera-Mag SpeedBeads (Thermo Fisher Scientific, 651520505025), resuspended in 30 µl 20% PEG 8000/2.5 m NaCl, incubated at RT for 15 min and placed on a magnet for two rounds of bead washing with 80% ethanol. Beads were air-dried for 10-12 min, and DNA was eluted from the beads by adding 40 µl dH2O. Supernatant was collected on a magnet and placed on ice or stored at −20°C until DNA blunting, poly(A)-tailing, and adapter ligation.
Sequencing libraries were prepared from generated cDNA by blunting, A-tailing, and adapter ligation as previously described (Gosselin et al., 2014) using bar-coded adapters (NextFlex, Bioo Scientific). Before final PCR amplification, RNA-seq libraries were digested by 30 min of incubation at 37°C with Uracil DNA Glycosylase (final concentration of 0.134 units per µl of library volume; UDG, Enzymatics G5010L) to generate strand-specific libraries. Libraries were PCR-amplified for 12-15 cycles and size-selected for fragments (200-350 bp) by gel extraction (10% TBE gels, Invitrogen EC62752BOX). RNA-seq libraries were single-end sequenced for 51 cycles on an Illumina HiSeq 4000 (Illumina) according to the manufacturer's instruction.
Differential gene expression and variability analysis
FASTQ files demultiplexed by Illumina bcl2fastqs from HiSeq4000 sequencing experiments were mapped to the UCSC genome build mm10. STAR with default parameters was used to map RNA-seq experiments (Dobin et al., 2013). The “analyzeRepeats” function of HOMER was used to quantify the gene expression raw counts with the parameters “-raw -count exons -strand both -condenseGenes” and a table of transcripts per million mapped reads (TPM) values using “-tpm - -count exons -condenseGenes” (Heinz et al., 2010). Raw counts within each gene body were used as input for DESeq2 (Love et al., 2014). Significance was assessed at a false discovery rate (FDR) of 0.05 using the Benjamini–Hochberg method and an effect size cutoff of 1.5-fold change in expression. For heatmaps, TPM of differentially expressed genes (DEGs) of sorted microglia of MBP29-hα-syn and WT mice or bulk tissue of the cortex, the corpus callosum, and the striatum of PLX5622- and control-fed MBP29-hα-syn and WT mice were determined. Average TPM values were calculated for each group. Heatmaps were based on Canberra distance matrices and Ward's minimum variance method for hierarchical clustering of groups with the pheatmap package in R. Gene ontology (GO) enrichment analysis was done using Metascape (http://metascape.org) (Tripathi et al., 2015; Zhou et al., 2019).
Regional log2 fold changes between MBP29-hα-syn and WT mice of the 43 differentially regulated genes in microglia of MBP29-hα-syn mice were analyzed through Ingenuity Pathway Analysis (IPA) from QIAGEN (Kramer et al., 2014). Comparative analysis was performed; and canonical pathways, upstream regulators, and diseases and functions were inferred after filtering for “mouse” as species and “nervous system” as the tissue of interest.
Statistics
Statistical analyses and visualization were performed using IBM SPSS Statistics 25 and GraphPad Prism 9 software (version 9, GraphPad Software), respectively. All statistical analyses were two-tailed. Normal distribution was assessed by the Shapiro–Wilk normality test and homogeneity of variance by the Levene test. As the majority of data contained samples which were not normally distributed or not homogeneous regarding their variance, a nonparametric statistical approach was chosen. To compare variables between two groups, the Mann–Whitney U test was performed for nonparametric datasets. Comparisons between more than two groups were performed using the Kruskal–Wallis test for pairwise comparison in combination with Dunn-Bonferroni post hoc method. As the analysis of TH+ cells in the SNpc and TH+ fibers in the striatum showed normal distribution and homogeneity of variance, we analyzed these data with a univariate ANOVA to determine the intersubject effect of the treatment. Two-sided p values ≤ 0.05 were considered significant. The specific tests used are indicated in the figure legends.
For behavioral analysis, animals (i.e., MBP29-hα-syn mice and WT littermates) in the same cage received the same diet (i.e., PLX5622-containing or control diet). Cages were randomly divided into two groups. Because of different coloring of the diet and overt phenotypical and behavioral changes of transgenic animals, the experimenter was not blinded before death. For quantitative analysis of histologic and protein data, the investigator was completely blinded.
Data availability
RNA-seq datasets are submitted to GEO: GSE197153. Additional data supporting the findings are available from the corresponding author, on reasonable request.
Results
RNA sequencing of isolated microglia reveals CSF1R signaling as potential target
Previously, we showed an increased myeloid cell activation in cerebral white matter regions of MBP29-hα-syn mice (Hoffmann et al., 2019). To characterize the gene expression of these cells, we isolated microglia from the forebrain of MBP29-hα-syn and WT mice using FACS (Fig. 1A). Microglia were labeled using CD11b-APC and CD45-A488 (Fig. 1B). Subsequent RNA-seq analysis revealed 43 DEGs between MBP29-hα-syn and WT mice (fold change > 1.5, FDR < 0.05; Fig. 1C). Upregulated genes mainly corresponded to a disease-associated phenotype (e.g., Apoe, Csf1, Itgax, Lpl), similarly observed in animal models of AD (Keren-Shaul et al., 2017), multiple sclerosis (MS) (Krasemann et al., 2017), and aging (Holtman et al., 2015) (Fig. 1D). GO term analysis identified differential expression of genes related to inflammatory responses and transmembrane receptor protein tyrosine kinase signaling pathways between MBP29-hα-syn and WT mice (Fig. 1E). Accordingly, increased CSF1 signaling was detected in microglia derived from MBP29-hα-syn mice by IPA (Fig. 1F). Therefore, we aimed to inhibit CSF1R signaling as a potential approach to reduce the inflammatory response in MBP29-hα-syn mice and potentially ameliorate functional deficits and improve the neuropathological phenotype.
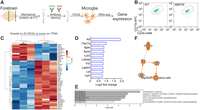
Disease-associated phenotype of isolated microglia from MBP29-hα-syn (MBP29) mice. A, Experimental setup for microglial isolation with subsequent RNA sequencing (RNA-seq). B, FACS of CD11b+/CD45low cells. Gating strategy for FACS is provided in Extended Data Figure 1-1. C, Heat map of DEGs of MBP29 compared with WT mice. D, Upregulated genes associated to inflammatory microglia in MBP29 compared with WT mice. E, GO terms of a pathway analysis. F, QIAGEN IPA identifies CSF1 signaling in MBP29 mice. Created with www.BioRender.com.
Figure 1-1
Gating strategy for FACS of isolated microglia. For the gating of microglia small particles were excluded first. A live/dead marker (DAPI) was used to exclude dead (DAPI+) cells. Remaining CD11b/CD45 double positive cells represented isolated microglia. FSC = Forward scatter; SSC = Side scatter. Download Figure 1-1, TIF file.
Severe motor phenotype with improved survival of MBP29-hα-syn mice after PLX5622 administration
Based on our RNA-seq of isolated microglia from MBP29-hα-syn mice and previously published data of restorative effects of myeloid cell depletion in animal models of AD (Dagher et al., 2015; Spangenberg et al., 2016, 2019; Unger et al., 2018), we investigated the impact of myeloid cell depletion using the CSF1R inhibitor PLX5622 in a mouse model of MSA. Administration was started at 4 weeks of age, as we previously observed myeloid cell activation as early as postnatal day 21 (Hoffmann et al., 2019) and PLX5622-containing diet was provided for a period of 12 weeks.
To analyze the effect of this long-term myeloid cell depletion regarding the onset and progression of motor symptoms, we scored dystonia-like behavior of the animals starting 6 weeks after the first administration and performed behavioral analyses at the end of the experimental paradigm (Fig. 2A).

Myeloid cell depletion influences survival and motor function of MBP29 mice. A, Experimental paradigm of PLX5622 (1,200 mg/kg) administration of MBP29 and WT mice for 12 weeks. Kaplan–Meier survival curve indicates (B) premature death of 24% of control-fed MBP29 (8 of 34) mice before the end of the administration (p ≤ 0.0001) and (C) onset and progression of neurologic symptoms over treatment time (p ≤ 0.0001). Statistical analysis was performed using log-rank test (Mantel-Cox). D, Frequency of neurologic symptoms (p ≤ 0.0001) and age at onset of symptoms after PLX5622 administration in MBP29 and WT mice (p = 0.031) (statistical analyses were performed using Mann–Whitney U test). Seven to 12 d before death, behavioral testing was performed including (E-H) beam walking, (I) pole, and (J,K) RotaRod test. The number of animals (sex-matched) analyzed in each test is indicated within the bar graphs. Statistical analyses for motor behavior were performed using Shapiro–Wilk to test normal distribution and the Levene test for homogeneity of variance followed by Kruskal–Wallis test for pairwise comparison in combination with Dunn–Bonferroni post hoc method. D-J, Data are indicated as mean ± SD. K, Data are mean ± SEM. *p ≤ 0.05. **p ≤ 0.01. ***p ≤ 0.001; ****p ≤ 0.0001.
Because of the predetermined endpoint for neuropathological analysis, a comprehensive assessment of survival of all animals was not initially intended. However, during long-term administration, all PLX5622-fed MBP29-hα-syn animals (n = 26 of 26) reached the endpoint of the experiment, while 24% of control-fed MBP29-hα-syn mice (n = 8 of 34) prematurely died (p ≤ 0.0001) (Fig. 2B).
During disease progression, MBP29-hα-syn mice develop symptoms resembling stress-induced dystonia-like behavior. We analyzed the presence of these dystonic symptoms weekly beginning at 10 weeks of age. Interestingly, the frequency of dystonic behavior was decreased by 51% (p ≤ 0.0001) (Fig. 2D, left) and the onset of symptoms was delayed by almost 3 weeks in PLX5622-fed MBP29-hα-syn mice (p = 0.031) (Fig. 2C,D, right). Moreover, 9 of 26 (34.6%) PLX5622-fed and only 1 of 34 (2.9%) control-fed MBP29-hα-syn mice did not develop dystonic behavior until the endpoint of the experiment (16 weeks of age; p ≤ 0.0001).
To assess the functional consequences of myeloid cell depletion on the motor phenotype, we sequentially performed behavioral tests, including beam walking, pole test, and RotaRod. First, analysis of the beam walking test revealed a severe motor deficit in MBP29-hα-syn mice compared with WT animals (Fig. 2E-H). Moreover, more than one-third of PLX5622-fed MBP29-hα-syn mice (35%) failed to complete the beam walking test (Fig. 2E). The distance traveled along the beam was reduced in PLX5622-fed MBP29-hα-syn mice compared with control-fed MBP29-hα-syn mice (27%; p = 0.00024; Fig. 2F). Compared with control diet, PLX5622-fed MBP29-hα-syn mice showed a decreased speed by 21% (Fig. 2G) and a 37% increased number of slips per centimeter (Fig. 2H), without reaching significance. While the pole test revealed no difference between PLX5622- and control-fed animals regarding the time spent on the pole or climbing downward (data not shown), we noticed that more than one-third of PLX5622-fed MBP29-hα-syn mice were unable to properly grasp the pole and failed to complete the task (Fig. 2I). Accordingly, the PLX5622-induced motor deficit in MBP29-hα-syn mice was confirmed by RotaRod, where we observed a reduced latency to fall off the rotating rod in MBP29-hα-syn mice by 44% (p = 0.00015), which was also detected in PLX5622-fed WT mice, however, to a lesser extent (26%; p = 0.016) (Fig. 2J,K).
In summary, long-term administration of PLX5622 for 12 weeks led to an improved survival and delayed onset of dystonic symptoms in MBP29-hα-syn mice, yet at the expense of reduced balance and motor function.
Long-term PLX5622 administration differentially depletes myeloid cells depending on the brain region and genotype
To analyze the efficacy of myeloid cell depletion as well as tolerability of PLX5622, we fed MBP29-hα-syn and WT mice with 1,200 mg/kg PLX5622-containing chow for a period of 3 weeks (Extended Data Fig. 3-1). Indeed, PLX5622 was well tolerated, and depletion efficacy of IBA1+ myeloid cells ranged from 64% to 79% depending on the brain region and genotype [MBP29-hα-syn mice: cortex (79%: p = 0.002) > striatum (76%; p = 0.002) > corpus callosum (73%; p = 0.009), WT: cortex (76%; p = 0.028) > corpus callosum (72%; p = 0.009) > striatum (64%; p = 0.022)] (Extended Data Fig. 3-1C).
In order to elucidate the neuropathological phenotype underlying the behavioral symptoms following depletion of myeloid cells for 12 weeks, we analyzed distinct brain regions displaying severe (corpus callosum, striatum) or less severe (cortex) neuroinflammation. We quantified the number of IBA1+ cells to determine the efficacy of myeloid cell depletion in the MBP29-hα-syn mouse model after long-term PLX5622 administration (Fig. 2A). Indeed, quantification of IBA1 expression revealed a widespread depletion of myeloid cells in the range of 72%-76% in MBP29-hα-syn and 94%-98% in WT mice (Fig. 3A,B). Depletion efficacy was higher in brain regions of WT animals [cortex (98%; p = 0.0001) > striatum (97%; p = 0.0001) > corpus callosum (94%; p = 0.00033)] compared with MBP29-hα-syn mice [cortex (76%; p = 0.001) > corpus callosum (74%; p = 0.001) > striatum (72%; p = 0.00017)]. The level of depletion was confirmed by complementary quantification of PU.1+ cells after 12 weeks of PLX5622 administration (MBP29-hα-syn: 68%-77%, WT: 85%-92%; Extended Data Fig. 3-2). Compared with 3 weeks of PLX5622 administration, depletion efficacy was more pronounced in WT animals after 12 weeks administration (Fig. 3A; Extended Data Fig. 3-1C). Interestingly, residual myeloid cells in MBP29-hα-syn mice showed a distinct morphology after PLX5622 administration (Fig. 3A). While myeloid cells in control-fed WT animals show highly ramified processes, myeloid cells in control-fed MBP29-hα-syn mice displayed an activated, amoeboid phenotype (Hoffmann et al., 2019) with a decrease in total process length (p = 0.002), branching level (p = 0.007), and arborization complexity compared with WT animals (Fig. 3C). PLX5622 administration altered the morphology of residual myeloid cells in MBP29-hα-syn mice toward increased process length (p = 0.048), branching level (not significant), and arborization complexity close to the cell body (Fig. 3C).

Myeloid cell depletion depends on the brain region and genotype. Representative images (A) and quantification (B) of IBA1+ expression in all three brain regions of MBP29 and WT mice fed with PLX5622 or control diet for 12 weeks. Dashed lines frame the corpus callosum. Scale bar, 50 μm. In addition, magnification of IBA1+ cells in the striatum is depicted for all cohorts, while magnification of all three regions is demonstrated for PLX5622-fed MBP29 mice only. Scale bar, 50 µm. Extended Data Figure 3-1 provides structural analysis of IBA1+ cells after short-term (3 weeks) administration of PLX5622 or control. C, Morphologic analysis of the process length, branch depth, branch level, and Sholl analysis of IBA1+ cells in the striatum of MBP29 and WT mice upon PLX5622 administration for 12 weeks. PLX5622 administration altered the morphology of residual myeloid cells in MBP29 toward increased process length (p = 0.048). Proliferation of myeloid cells after depletion with PLX5622 for 12 weeks is provided in Extended Data Figure 3-2. D, Heat map showing 26 DEGs that are overlapping in all three brain regions and (E) GO term analysis of PLX5622- compared to control-fed WT mice for the corpus callosum. Data are mean ± SD; n = 10 animals per group, sex-matched. Statistical analyses were performed using the Shapiro–Wilk test to test normal distribution and the Levene test for homogeneity of variance followed by the Kruskal–Wallis test for pairwise comparison in combination with the Dunn-Bonferroni post hoc method. *p ≤ 0.05. **p ≤ 0.01. ***p ≤ 0.001. ****p ≤ 0.0001.
Figure 3-1
Short-term administration of PLX5622. (A) Experimental timeline of PLX5622 (1200 mg/kg) administration of MBP29 and WT mice for 3 weeks. (B) Schematic of a coronal brain sections with analyzed brain regions (CC = Corpus callosum; CTX = Cortex; STR = Striatum). (C) Representative images and quantification of IBA1+ cell density in respective brain regions of MBP29 and WT mice fed with PLX5622 or control. Dashed lines frame the corpus callosum. Scale bar: 50 µm. (D) α-syn expression (green) and (E) myelin content (Heidenhain Woelke staining) in different brain regions of WT and MBP29-hα-syn mice fed with either control or PLX5622 for 3 weeks. Scale bars: (D) 20 µm; (E) 200 µm (D). Data are mean ± SD (n = 5 animals per group). Statistical analyses were performed using Shapiro–Wilk to test normal distribution and the Levene test for homogeneity of variance followed by Kruskal–Wallis test for pairwise comparison in combination with Dunn-Bonferroni post hoc method or Mann–Whitney U test (α-syn (D)). *p ≤ 0.05; **p ≤ 0.01; ***p ≤ 0.001. Download Figure 3-1, TIF file.
Figure 3-2
Proliferation of myeloid cells after depletion with PLX5622. (A) Representative maximum intensity projections of the corpus callosum of PU.1 (green) and BrdU (magenta) staining in MBP29 and WT mice fed with either PLX5622 or control diet for 12 weeks. Scale bar: 50 µm. Magnification of a double positive cell is depicted in the upper right corner. Scale bar: 25 µm. Quantification of (B) BrdU+ cells, (C) PU.1 + cells and (D) BrdU+/PU.1+ cells is presented in the cortex, the corpus callosum, and the striatum. (E) Representative maximum intensity projection showing the matching overlay of PU.1 (green) and BrdU (magenta) with IBA1 (white) signal in the striatum. Scale bar: 20 µm. Data are mean ± SD (n = 6 animals per group, sex-matched). Statistical analyses were performed using Shapiro–Wilk to test normal distribution and the Levene test for homogeneity of variance followed by Kruskal–Wallis test for pairwise comparison in combination with Dunn-Bonferroni post hoc method. *p ≤ 0.05; **p ≤ 0.01; ***p ≤ 0.001. Download Figure 3-2, TIF file.
To assess the impact of PLX5622 on transcriptional changes in different brain regions, bulk RNA-seq of WT animals was performed. Similar to the structural phenotype, common transcriptional changes between the cortex, the corpus callosum, and the striatum of WT animals were related to myeloid cell gene expression (Fig. 3D). Several downregulated transcripts associated with microglia-specific expression profiles, such as C1qb, P2ry12, Tmem119, Hexb, and Trem2 (Gerrits et al., 2020), confirmed a myeloid cell reduction. For WT animals, 26 of these DEGs were shared between the regions (fold change > 1.5, FDR < 0.05) (Fig. 3D). Pathways related to inflammation and myeloid cell responses, such as phagocytosis, inflammatory response, and cytokine production, were dominant in the GO term analysis of WT animals (Fig. 3E). In conclusion, myeloid cell depletion on PLX5622 administration was highly efficient and reduced the myeloid cell expression profile in WT mice.
Following depletion, microglia are able to rapidly proliferate and repopulate the parenchyma after withdrawal of PLX5622 (Elmore et al., 2015; Huang et al., 2018). Moreover, increased microglial proliferation was previously observed in MBP29-hα-syn compared with WT animals (Hoffmann et al., 2019). Therefore, we investigated the proliferation of residual myeloid cells after PLX5622 administration by injection of BrdU on 5 consecutive days before death (Fig. 2A) and quantified the number of PU.1+/BrdU+ cells (Extended Data Fig. 3-2). To this end, we observed a 10-fold increase in proliferating myeloid cells after administration of PLX5622 in MBP29-hα-syn (cortex: p = 0.008; striatum p = 0.069) and WT mice (cortex: p = 0.001; striatum: p = 0.035) compared with control-fed animals while the overall number of proliferating cells (BrdU+ cells/mm2) was not changed (Extended Data Fig. 3-2). Moreover, WT animals showed 2-3 times more proliferating residual myeloid cells than MBP29-hα-syn mice after PLX5622 administration (Extended Data Fig. 3-2).
Together, myeloid cells were efficiently depleted by PLX5622 long-term administration in WT animals and to a lesser degree in MBP29-hα-syn mice. In addition, residual myeloid cells obtained a highly proliferative phenotype in both MBP29-hα-syn and WT animals after administration of PLX5622.
PLX5622 administration does not alter α-syn and myelin levels
As MBP29-hα-syn mice express high levels of human α-syn in white matter regions (Shults et al., 2005) and myeloid cells are crucial for phagocytic processing of pathologic protein aggregates (Galloway et al., 2019), we asked whether the reduction of myeloid cells changes the protein level of human α-syn in the different brain regions. Protein levels were most prominently increased in the corpus callosum of control-fed MBP29-hα-syn compared to WT mice (p = 0.014). Yet, no change was observed between PLX5622- and control-fed animals after 3 weeks (Extended Data Fig. 3-1D) and 12 weeks (Fig. 4A).
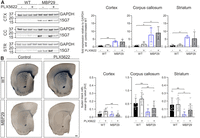
No change in α-syn levels or myelin content in MBP29 mice after PLX5622 administration. A, Representative Western blot images of α-syn relative to GAPDH in the cortex (CTX), corpus callosum (CC), and striatum (STR). Right, Bar graphs represent the quantification of α-syn. Fold expression is visualized relative to control-fed WT mice (dashed line). B, Representative images of coronal sections of Sudan black staining intensity of MBP29 and WT mice fed with either PLX5622 or control diet for 12 weeks. Sudan black staining was used to visualize myelin lipids. Scale bar, 200 µm. For quantification, calibrated mean gray values are depicted on the right. Data are mean ± SD; n = 10 (staining) or n = 4 (Western Blot) animals per group, sex-matched. Statistical analyses were performed using the Shapiro–Wilk test to test normal distribution and the Levene test for homogeneity of variance followed by the Kruskal–Wallis test for pairwise comparison in combination with the Dunn-Bonferroni post hoc method. *p ≤ 0.05. **p ≤ 0.01. Further analysis of oligodendrocyte numbers and GFAP+ astrocytes is provided in Extended Data Figure 4-1.
Figure 4-1
OLIG2+ cell numbers and GFAP+ area are unchanged after PLX5622 administration. (A) Representative images of OLIG2 expression (red) in the cortex, corpus callosum, and striatum of MBP29 and WT mice fed with either PLX5622 or control diet for 12 weeks. Nuclei were visualized using DAPI (white). Dashed lines frame the corpus callosum. Scale bar: 20 μm. Quantification of OLIG2+/mm2 cells of MBP29 and WT mice fed with PLX5622 or control is indicated on the right. Data are mean ± SD (n = 10 animals per group, sex-matched). (B) Representative maximum intensity images of GFAP expression (cyan) and SOX2 (red) in the cortex, corpus callosum, and striatum of MBP29 and WT mice fed with either PLX5622 or control for 12 weeks. Nuclei were visualized using DAPI (white). Dashed lines frame the corpus callosum. Scale bar: 10 μm. Quantification of GFAP+ area of MBP29 and WT mice fed with PLX5622 or control is indicated on the right. Data are mean ± SD (n = 4 animals per group, sex-matched). Statistical analyses were performed using Shapiro–Wilk to test normal distribution and the Levene test for homogeneity of variance followed by Kruskal–Wallis test for pairwise comparison in combination with Dunn-Bonferroni post hoc method. *p ≤ 0.05; **p ≤ 0.01; ***p ≤ 0.001. Download Figure 4-1, TIF file.
Notably, MBP29-hα-syn mice show an early myelin deficit in numerous white matter regions (Shults et al., 2005; Ettle et al., 2016; Meszaros et al., 2021). However, structural analysis of the myelin lipid content in different brain regions indicated no impact of myeloid cell depletion on myelin lipids in white matter regions of MBP29-hα-syn mice after 3 weeks (Extended Data Fig. 3-1E) or long-term PLX5622 administration (Fig. 4B). At the same time, we confirmed an increased number of oligodendrocyte transcription factor 2 (OLIG2)+ cells in white matter regions of MBP29-hα-syn compared with WT mice (corpus callosum: p = 0.00018, striatum: p = 0.001) (Ettle et al., 2016), while PLX5622 administration did not change the number of OLIG2+ cells in white and gray matter regions of MBP29-hα-syn and WT mice (Extended Data Fig. 4-1A). Accordingly, the percentage of GFAP+ area, labeling astrocytes, was increased in the cortex of MBP29-hα-syn compared with WT mice (p = 0.017), while no change was observed in PLX5622- compared with control-fed animals (Extended Data Fig. 4-1B).
Collectively, these results suggest that myeloid cell depletion has no effect on human α-syn and myelin levels as well as on oligodendrocyte numbers and GFAP+ astrocytes in PLX5622-fed MBP29-hα-syn mice.
PLX5622 administration modifies TH+ neurons in MBP29-hα-syn and WT mice
Because of the severe motor deficit of MBP29-hα-syn mice on PLX5622 long-term administration, we hypothesized an impact of myeloid cell depletion on the integrity of the dopaminergic striato-nigral system. First, we identified that TH+ somas were reduced in the SNpc of PLX5622-fed MBP29-hα-syn mice by 19% and WT mice by 20% (intersubject effect of the diet: F(1,37) = 5.577, p = 0.024) (Fig. 5A). Next, we analyzed the striatal TH+ fiber density within the groups (Fig. 5B; Extended Data Fig. 5-1). We observed no significant alteration of TH+ fiber density of MBP29-hα-syn and WT animals on PLX5622 administration (Fig. 5B) but an increased TH+ fiber length of 45% in MBP29-hα-syn and 24% in WT mice on PLX5622 administration (intersubject effect of the diet: F(1,37) = 10.207, p = 0.003) (Fig. 5B). Together, these results indicate that myeloid cell depletion reduces the number of TH+ dopaminergic somas in the SNpc but increases TH+ striatal fiber length.
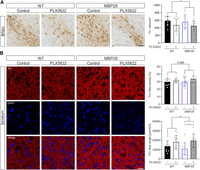
Reduced numbers of TH+ neurons in the substantia nigra pars compacta (SNpc) upon PLX5622 administration. A, Representative images of TH expression and quantification of TH+ cells/mm2 in the SNpc of MBP29 and WT mice fed with PLX5622 or control diet for 12 weeks. Scale bar, 50 µm. B, Representative images and quantification of TH fiber density and length in the striatum. TH staining was quantified using the TH+ pixels per area (top) and the skeletonize plugin of the ImageJ software (bottom). Work flow for image analysis is presented in Extended Data Figure 5-1. Scale bar, 20 µm. Data are mean ± SD; n = 10 animals per group, sex-matched. Statistical analyses were performed using the Shapiro–Wilk test to test normal distribution and the Levene test for homogeneity of variance followed by the Kruskal–Wallis test for pairwise comparison in combination with the Dunn-Bonferroni post hoc method. *p ≤ 0.05. **p ≤ 0.01. The univariate ANOVA was used to determine the intersubject effect of the treatment, which was significantly changed for TH+ cell numbers (A) (F(1,37) = 5.577, p = 0.024) and TH+ fiber length (B) (F(1,37) = 10.207, p = 0.003) independent of the genotype.
Figure 5-1
TH+ fiber analysis. For quantification of TH+ fibers, images were captured using a Zeiss LSM 780 confocal scanning laser microscope. In each section, four areas depicted within the striatum were imaged by capturing three different z positions in the middle layer of the section. Three sections were analyzed per animal. For image analysis, the following workflow was chosen: Images were first converted to 8-bit images, and a threshold was applied using the Otsu auto-threshold method (Kneynsberg et al., 2016). To determine the density of TH+ fibers, the percentage of area covered by fibers (pixels within threshold limits) was measured using ImageJ. In addition, the total fiber length was determined using the “Skeletonize (2D/3D)” plugin in ImageJ (Stemick et al., 2020). Download Figure 5-1, TIF file.
Dysregulation of synaptic function in MBP29-hα-syn mice on PLX5622 administration
To investigate transcriptional changes on myeloid cell depletion in MBP29-hα-syn and WT mice, we isolated RNA from the cortex, the corpus callosum, and the striatum. Overall, we observed differential gene expression among all groups, while the highest number of DEGs was detected in the corpus callosum of PLX5622- and control-fed animals (Fig. 6A). Similar to the RNA-seq analysis of sorted microglia (Fig. 1C,D), whole-brain tissue of MBP29-hα-syn mice exhibited an upregulation of transcripts indicative of a disease-associated microglial state (e.g., Apoe, C1qa, Trem2, Csf1r, Axl) in the corpus callosum (Fig. 6B) and several dysregulated pathways associated with microglia function and inflammation (Fig. 6C). Moreover, a downregulation of the myelin-associated oligodendrocyte basic protein (Mobp) was observed, confirming the neuropathological phenotype of MBP29-hα-syn mice (Fig. 6B). Since disruptions of extracellular matrix (ECM) organization have been previously identified in patients with CNS disease such as AD (Snow et al., 1988, 1990) or MS (Van Horssen et al., 2007) being a potential target for functional recovery (Bonneh-Barkay and Wiley, 2009), we analyzed ECM-related gene expression. Interestingly, we discovered that 20 transcripts linked to ECM organization (e.g., Col8a1, Nid2, Col9a3) were upregulated in the corpus callosum of MBP29-hα-syn mice compared with WT animals and to the same extent downregulated in PLX5622-fed MBP29-hα-syn mice (Fig. 6D).
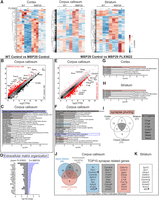
Bulk RNA sequencing of different brain regions from MBP29 mice after PLX5622 administration. A, Heat maps of DEGs in the cortex, corpus callosum, and striatum of PLX5622- and control-fed MBP29 and WT mice. B, Scatter plot represents relative gene expression of RNA transcripts and (C) resulting GO terms in the corpus callosum of control-fed WT compared with MBP29 mice. D, Log2 fold change of DEGs associated with ECM organization upregulated in control-fed MBP29 compared with WT mice and downregulated in MBP29 mice on PLX5622 administration. E, Scatter plot represents relative gene expression of RNA transcripts in the corpus callosum of mice fed with PLX5622 compared with control. GO term analysis of DEGs is depicted for the (F) corpus callosum, (G) cortex, and (H) striatum of control- compared with PLX5622-fed MBP29 animals. I, Venn diagram with genes associated with synapse pruning in respective brain regions and a list of the shared genes among the three regions. J, Selected DEGs associated with synapses in the corpus callosum relevant for signal release, regulation of transsynaptic signaling, and synapse pruning depicted in a Venn diagram. Right boxes, Top 10 DEGs for each pathway. K, DEGs related to synaptic function and neuronal survival in the striatum. J, K, Arrows (↑) indicate upregulation.
Comparing control- with PLX5622-fed MBP29-hα-syn mice, we observed a decrease of myeloid cell-associated genes (e.g., C1qb, Csf1r, Cx3cr1) as previously shown for WT animals (Fig. 3D,E) and an increase of Snca and Mobp (Fig. 6E). In addition, several synapse-related genes were dysregulated in the corpus callosum (Fig. 6E,F), the cortex (Fig. 6G), and the striatum (Fig. 6H). The Venn diagram in Figure 6I depicts dysregulated genes associated with synaptic pruning in the different brain regions of PLX5622- and control-fed MBP29-hα-syn mice. Overall, 7 DEGs, all associated with microglia, were shared between analyzed regions, including the complement components C1qa, b, and c, Cx3cr1, and Trem2 (Fig. 6I). We identified 111 DEGs linked to synapse-related pathways in the corpus callosum (Fig. 6J). Ten DEGs of each pathway (signal release, transsynaptic signaling, and synapse pruning) are highlighted in Figure 6J. In particular, genes related to calcium signaling (e.g., Camk2a, Camk2b, and Cacng8) and synaptic genes important for proper signal transduction, such as Syn1, Syp, and Adcy8, were downregulated. RNA-seq findings from the striatum, which is involved in motor function, confirmed these alterations, showing a significant downregulation of genes important for synaptic function and neuronal survival (e.g., Syt13, Syn1, and Gabbr2). Interestingly, Mt2, an important regulator for neurite extension of dopaminergic neurons, was upregulated in the striatum by 1.5-fold (Fig. 6K).
In summary, myeloid cell depletion mediated extensive changes in gene expression relevant to synaptic function and neuronal survival mainly in the corpus callosum and the striatum of MBP29-hα-syn mice.
Discussion
The importance of neuroinflammation in MSA has been previously highlighted (Ishizawa et al., 2004; Salvesen et al., 2015; Kübler et al., 2019) while its precise contribution to disease pathogenesis is not yet understood. Similar to other tissue-resident macrophages, microglial development, survival, and maintenance depend on CSF1R signaling. Pharmacological CSF1R inhibition has been studied in recent years as a potential therapeutic target in age-related contexts (Elmore et al., 2018) and particularly in neurodegenerative diseases (Dagher et al., 2015; Nissen et al., 2018; Unger et al., 2018). Thus, we used the CSF1R inhibitor PLX5622 in an MSA mouse model to determine the role of myeloid cells during disease progression. Upon long-term administration of PLX5622, we identified a two-faced outcome characterized by reduced inflammatory signals, an extended lifespan, and delayed onset of neurologic symptoms, however, a converse aggravation of motor deficits and alterations in neuronal and synaptic regulation in MBP29-hα-syn mice.
Similar to other mouse models, PLX5622 administration in MBP29-hα-syn mice resulted in a widespread depletion of myeloid cells in different brain regions, which was even more pronounced in WT animals. A genotype-dependent depletion efficacy with higher numbers of residual IBA1+ cells in transgenic animals was previously described in the APP-PS1 mouse model for AD (Unger et al., 2018). Residual cells maintained a distinct star-shaped morphology and an increased proliferative capacity, indicating a different activation pattern compared with myeloid cells in WT or control-fed MBP29-hα-syn mice (Prinz et al., 2011; Heindl et al., 2018; Schwabenland et al., 2021).
In contrast to 5xFAD mice, we did not detect a reduced α-syn pathology in PLX5622-fed MBP29-hα-syn mice (Spangenberg et al., 2019). Indeed, mouse Snca gene expression was upregulated in PLX5622 compared with control-fed MBP29-hα-syn mice similar to a more recent α-syn propagation study (George et al., 2019).
While quantification of myelin and oligodendrocytes confirmed the severe deficit of myelin in MBP29-hα-syn compared with WT mice, PLX5622 identified no restorative effect on α-syn-induced oligodendrogliopathy. This finding is further supported by a study obtained in a neurotropic coronavirus infection demonstrating that demyelination was even exacerbated and remyelination impaired on ablation of myeloid cells (Sariol et al., 2020). Oligodendrocyte numbers were increased in MBP29-hα-syn mice as previously shown (Ettle et al., 2016), without further changes upon PLX5622 administration. In contrast, therapeutic CSF1R-dependent myeloid cell depletion increased oligodendrocyte numbers and enhanced remyelination, particularly in the corpus callosum in models of MS (Beckmann et al., 2018; Nissen et al., 2018), indicating disease context-dependent effects of myeloid cell depletion.
To evaluate the behavioral phenotype, animals were analyzed at 16 weeks of age when motor deficits are present and premature death occurs (Shults et al., 2005). To our surprise, we did not observe changes in the latency to fall by RotaRod or reduced performance score of beam walking and pole test in control-fed MBP29-hα-syn compared with WT mice, which was in contrast to previously published results (Shults et al., 2005). However, CSF1R inhibition improved the survival rate, delayed the onset, and reduced the frequency of dystonic symptoms, indicating that myeloid cell depletion has important beneficial effects in MBP29-hα-syn mice. Accordingly, CSF1R-dependent improvement of cognitive deficits and disease scores has previously been described in AD (Dagher et al., 2015) and MS mouse models (Nissen et al., 2018), respectively. On the contrary, we recognized severe motor deficits in PLX5622-fed MBP29-hα-syn mice which was accompanied by the loss of dopaminergic neurons in the SNpc. In this line, Yang et al. (2018) described a deterioration of motor function and a reduction of TH+ neurons and neurites on myeloid cell depletion in a toxin-induced mouse model for Parkinson's disease. Thus, these results indicate that myeloid cell depletion in a model of MSA is associated with a two-faced outcome similar to data obtained in a mouse model of amyloid pathology (Chen and Colonna, 2022).
Axonal dopaminergic terminals within the striatum degenerate before the loss of nigral dopaminergic neurons leading to a reduced density of TH+ synaptic terminals and reduced striatal dopamine levels (Chung et al., 2009). Despite the reduced number of TH+ somas in the SNpc, we did not observe a loss of striatal projections in MBP29-hα-syn mice. In contrast, an increased fiber length was detected on myeloid cell depletion, suggesting an increased neuritic outgrowth at the target site. Outgrowth of TH+ dopaminergic neurons was also affected on microglial depletion in the embryonic forebrain (Squarzoni et al., 2014). This observation is strengthened by the increased expression of Mt2 (metallothionein 2), which has been shown to stimulate neurite extension from primary dopaminergic neurons (Kohler et al., 2003). However, an increased transport of TH into the neurite resulting in a reduction of TH+ staining within the cell soma may also be considered as TH mRNA is transported from the soma to the axon where it is locally translated to facilitate dopamine synthesis (Gervasi et al., 2016). Severe motor deficits and epilepsy accompanied by neuronal loss are observed in patients carrying a loss-of-function mutation in CSF1R, known as adult-onset leukoencephalopathy with axonal spheroids and pigmented glia. These patients have a reduced myeloid cell number (Chitu et al., 2016; Freuchet et al., 2021), which further suggests an important role of CNS myeloid cells in maintaining proper neuronal functions (Glezer et al., 2007; Zhu et al., 2016). Survival of dopaminergic neurons is promoted by microglia-derived neurotrophic factors, such as the glial cell line-derived neurotrophic factor previously used in clinical trials of Parkinson's disease (Kordower, 2003; Ding et al., 2004). Furthermore, loss of microglial brain-derived neurotrophic factor from the whole brain recapitulates defects in motor learning-dependent synapse formation, which has been observed on microglia depletion (Parkhurst et al., 2013).
Indeed, our bulk RNA-seq analysis revealed dysregulation of synapse-related pathways and downregulation of genes associated with synapse pruning in PLX5622-fed MBP29-hα-syn animals. Most of these downregulated genes are associated with microglia function, being the primary cell type involved in synaptic pruning during postnatal development (Wu et al., 2015), and also in the adult CNS (Schafer et al., 2013; Kierdorf and Prinz, 2017). In addition, we observed dysregulations in signal release and regulation of transsynaptic signaling in the corpus callosum of PLX5622-fed MBP29-hα-syn animals. Importantly, changes in synaptic gene expression were also present in the striatum (e.g., downregulation of Syt13, Synaptotagmin 13), which promotes neuronal survival across motor neurons (Nizzardo et al., 2020). Furthermore, genes associated with ECM organization were decreased in PLX5622 compared with control-fed MBP29-hα-syn mice. Accordingly, Arreola et al. (2021) identified a predominant dysregulation of neuronal gene expression and disruption of ECM organization in CSF1R haploinsufficient (CSF1R+/−) mice showing reduced microglial numbers. ECM is a macromolecular network composed of polysaccharides and proteins between neurons and glia (Nicholson and Syková, 1998). Despite being a physical barrier to reduce diffusion of molecules and cell migration, it also functions as a regulator of neurite outgrowth, synaptogenesis, synaptic stabilization, and plasticity (Burnside and Bradbury, 2014; Song and Dityatev, 2018). Disruptions of ECM organization have been previously identified in patients with CNS disease, such as AD (Snow et al., 1988, 1990) and MS (Van Horssen et al., 2007), revealing a potential target for functional recovery (Bonneh-Barkay and Wiley, 2009).
While this study used a 4-group design with sufficient number of sex-balanced and age-matched animals, we are aware of its limitations. (1) We chose the term “myeloid cells” to describe CNS-resident inflammatory cells as we cannot exclude that peripheral myeloid cells, including border-associated macrophages or blood-derived monocytes, infiltrate the brain parenchyma and contribute to the neuropathology in MBP29-hα-syn mice. Changes of the peripheral blood monocyte composition have been identified in MSA patients (Matsuse et al., 2020; Rydbirk et al., 2020), and peripheral myeloid and lymphoid infiltrates have been described in brain tissue of MSA patients and corresponding mouse models (Williams et al., 2020; Torre-Muruzabal et al., 2022). Together, this indicates that myeloid cell responses may not be exclusively executed by microglia. (2) Long-term administration of PLX5622 up to 6 months has been demonstrated to be well tolerated by WT and 5xFAD animals without adverse effects (Spangenberg et al., 2019) being in line with our observations in WT animals. However, we cannot exclude long-term effects at time points later than 16 weeks of age. (3) While the majority of synaptic pruning and developmental neuronal connectivity is completed in the early postnatal phase of juvenile mice (Paolicelli and Ferretti, 2017; Hammond et al., 2018), a potential impact of myeloid cell depletion at 4 weeks of age on synapse formation, neuronal outgrowth, and circuit connectivity may still be possible, which might contribute to adverse motoric effects in MBP29-hα-syn mice (Tremblay et al., 2010; Parkhurst et al., 2013).
In conclusion, our findings shed light on the complex role of myeloid cells in MSA by demonstrating a two-faced effect of myeloid cell depletion on the lifespan, the behavioral phenotype, synaptic gene regulation, and neuronal circuitries of MBP29-hα-syn mice. This study highlights that myeloid cells do not only play a role in inflammatory processes in MSA, but also significantly support neuronal function which needs to be considered for future therapies targeting myeloid cells.
Footnotes
- Received March 22, 2022.
- Revision received August 3, 2022.
- Accepted August 15, 2022.
-
This work was supported by the Deutsche Forschungsgemeinschaft 270949263/GRK2162 and the Multiple System Atrophy Coalition. K.B. is a graduate student of the research training group 2162 “Neurodevelopment and Vulnerability of the Central Nervous System” of the Deutsche Forschungsgemeinschaft 270949263/GRK2162 and the Interdisciplinary Center for Clinical Research at the University Hospital of the Friedrich-Alexander-Universität Erlangen-Nürnberg (J92). A.H. was a member of the research training group 2162 of the Deutsche Forschungsgemeinschaft 270949263/GRK2162 and received a start-up grant. A.H. was supported by the Erstantragsstellerprogramm of the Interdisciplinary Center for Clinical Research (J92) and BaCaTeC (Bavaria California Technology Center). J.W. is a member of the research training group 2162 of the DFG 270949263/GRK2162, the Interdisciplinary Center for Clinical Research at the University Hospital of the Friedrich-Alexander-Universität Erlangen-Nürnberg, and the Bavarian Research Association “Interaction of Human Brain Cells” (ForInter) funded by the Bavarian State Ministry of Science and the Arts. This work was supported by NIH/NIA R01 grants AG058252, AG073979, AG051848 to R.A.R. and biomarker core funds to R.A.R. from AG057437 (USC ACTC), AG010483 (UCSD ADCS) and AG062429 (UCSD ADRC). PLX5622 was kindly provided by Plexxikon. We thank Holger Meixner and Floyd Sarsoza for excellent technical support; Dr. Wei Xiang for supporting the biochemical analyses; Heiko Gaßner for advice in statistical analysis; and Prof. Dr. Beate Winner, Prof. Dr. Veronique Miron, and Niamh McNamara for valuable input on the manuscript.
-
The authors declare no competing financial interests.
- Correspondence should be addressed to Alana Hoffmann at Alana.hoffmann{at}uk-erlangen.de
- Copyright © 2022 the authors




