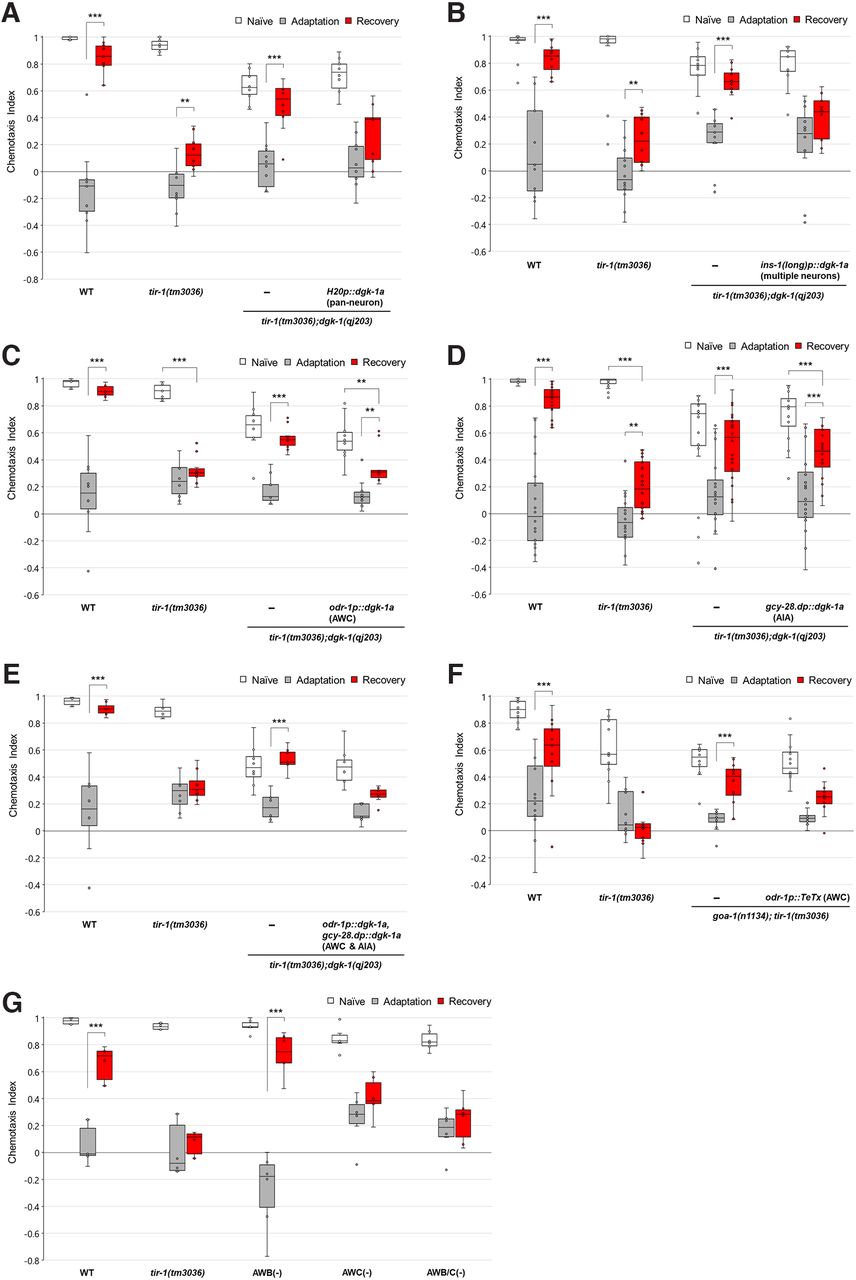
DGK-1 works in several neurons, including AWC and AIA in the regulation of forgetting. A–E, Transgenic rescue of the tir-1(tm3036);dgk-1(qj203) mutant's phenotype by expressing the WT dgk-1 gene isoform under its pan-neuronal (H20) (A), multiple neuronal (ins-1(long)) (B), AWC (odr-1) (C), AIA (gcy-28.d) (D) promoter, or AWC (odr-1) and AIA (gcy-28.d) promoter combined (E). Chemotaxis of naive, adapted, and 4 h recovered animals was analyzed. Asterisks indicate significant differences between after adaptation and after 4 h recovery or between naive and after 4 h recovery. A, WT: p = 2.60 × 10⁻²³; tir-1(tm3036): p = 0.00248; tir-1;dgk-1 (Ex-): p = 1.03 × 10⁻⁷ (n = 10, F(6,108) = 17.52, p = 4.47 × 10⁻¹⁴). B, WT: p = 7.15 × 10⁻¹³; tir-1(tm3036): p = 0.00568; tir-1;dgk-1 (Ex-): p = 9.15 × 10⁻⁶ (n = 12, F(6,132) = 6.73, p = 3.10 × 10⁻⁶). C, Adaptation versus recovery in WT: p = 1.58 × 10⁻²³; tir-1;dgk-1 (Ex-): p = 6.65 × 10⁻⁹; tir-1;dgk-1;Ex[odr-1p::dgk-1a]: p = 0.00232; and Naive versus recovery in tir-1(tm3036): p = 3.71 × 10⁻¹⁶; tir-1;dgk-1;Ex[odr-1p::dgk-1a]: p = 0.00191 (n = 10, F(6,108) = 17.88, p = 2.63 × 10⁻¹⁴). D, Adaptation versus recovery in WT: p = 1.97 × 10⁻²¹; tir-1;dgk-1 (Ex-): p = 2.51 × 10⁻⁵; tir-1;dgk-1;Ex[gcy-28.dp::dgk-1a]: p = 0.000298; and Naive versus recovery in tir-1(tm3036): p = 5.37 × 10⁻²¹; tir-1;dgk-1;Ex[odr-1p::dgk-1a]: p = 0.000316 (n = 20, F(6,228) = 15.11, p = 1.51 × 10⁻¹⁴). E, WT: p = 2.30 × 10⁻¹⁹; tir-1;dgk-1 (Ex-): p = 1.47 × 10⁻⁶ (n = 8, F(6,84) = 18.72, p = 1.05 × 10⁻¹³). F, Effect of inhibiting synaptic transmission from AWC sensory neurons by expressing TeTx in goa-1;tir-1 mutants. Asterisks indicate significant differences between after adaptation and after 4 h recovery. WT: p = 1.84 × 10⁻⁵; goa-1;tir-1 (Ex-): p = 0.000260 (n = 12, F(6,132) = 6.00, p = 1.42 × 10⁻⁵). G, Analyzing forgetting defect of olfactory adaptation in AWB-ablated (str-1p::mCasp-1), AWC-ablated (ceh-36p::caspase-3(p12)::nz + ceh-36p::cz::caspase-3(p17)), and AWB/C-ablated (odr-1p::mCasp1) animals. WT: p = 2.07 × 10⁻⁹; AWB (–): p = 2.48 × 10⁻¹⁸ (n = 6, F(8,75) = 13.62, p = 5.51 × 10⁻¹²). Box plots: center line indicates median. Box range, 25th-75th percentiles. Whiskers represent minimum-maximum values. Dots represent the data points. External dots from whisker represent outliers. **p < 0.01; ***p < 0.001; two-way ANOVA with Bonferroni correction.


