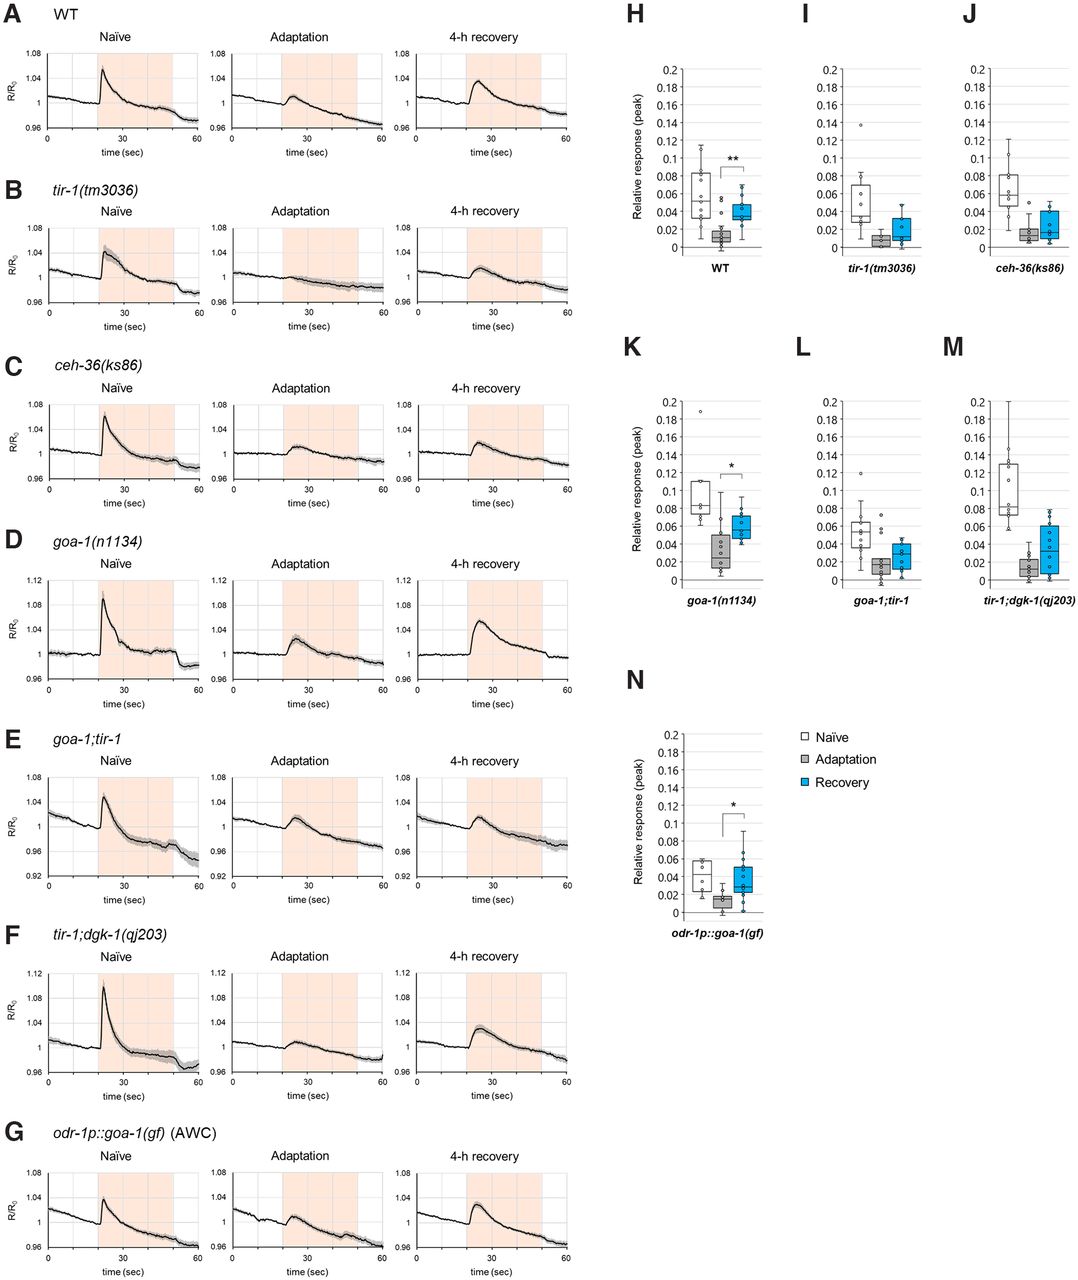
The Ca2+ response in AWA olfactory neurons is inconsistent with the behavior after a 4 h recovery of the goa-1;tir-1 and tir-1;dgk-1 double mutants, and the goa-1(gf)-expressing mutant. A–G, Quantification of the Ca2+ response of naive, adapted, and 4 h recovered animals. Averaged traces of the Ca2+ response in WT animals (n ≥ 18) (A), tir-1(tm3036) mutants (n ≥ 10) (B), ceh-36(ks86) mutants (n ≥ 12) (C), goa-1(n1134) mutants (n ≥ 10) (D), goa-1(n1134);tir-1(tm3036) double mutants (n ≥ 15) (E), tir-1(tm3036);dgk-1(qj203) double mutants (n ≥ 14) (F), and WT animals with overexpression of goa-1(gf) in AWC neurons (n ≥ 10) (G). Pink-colored background represents the timing of the diacetyl stimulation (from 20 to 50 s). R represents the YFP/CFP ratio, and R0 represents the averaged ratio of 5 s before diacetyl stimulation. H–N, Peak values of the quantitated Ca2+ responses (A–G) in WT (H), tir-1(tm3036) (I), ceh-36(ks86) (J), goa-1(n1134) (K), goa-1(n1134);tir-1(tm3036) (L), tir-1(tm3036);dgk-1(qj203) (M) animals, and WT animals with overexpression of goa-1(gf) in AWC neurons (N). Asterisks indicate significant differences between after adaptation and after 4 h recovery. H, WT: p = 0.00182 (n = 18, 19, 23, F(2,57) = 17.23, p = 1.40 × 10⁻⁶); I, tir-1: (n = 11, 10, 12, F(2,30) = 9.75, p = 0.000548); J, ceh-36: (n = 13, 12, 14, F(2,36) = 20.05, p = 1.41 × 10⁻⁶); K, goa-1: p = 0.0285 (n = 10, 14, 16, F(2,37) = 16.97, p = 5.89 × 10⁻⁶); L, goa-1;tir-1: (n = 15, 15, 17, F(2,44) = 9.92, p = 0.000278); M, tir-1;dgk-1: (n = 14, 15, 18, F(2,44) = 32.68, p = 2.00 × 10⁻⁹); N, odr-1p::goa-1(gf): p = 0.0120 (n = 12, 10, 18, F(2,37) = 5.40, p = 0.00877). Box plots: center line indicates median. Box range, 25th-75th percentiles. Whiskers represent minimum-maximum values. Dots represent the data points. External dots from whisker represent outliers. *p < 0.05; **p < 0.01; one-way ANOVA with Tukey–Kramer multiple test.


