Tsh Induces Agrp1 Neuron Proliferation in Oatp1c1-Deficient Zebrafish
- Talya Wasserman-Bartov1,2,
- Inbal Admati1,2,
- Ilana Lebenthal-Loinger1,
- Julia Sharabany1,2,
- Tali Lerer-Goldshtein1,2, and
- Lior Appelbaum1,2
- 1The Faculty of Life Sciences, Bar-Ilan University, Ramat-Gan 5290002, Israel
- 2The Multidisciplinary Brain Research Center, Bar-Ilan University, Ramat-Gan 5290002, Israel
-
Author contributions: T.W.-B., T.L.-G., and L.A. designed research; T.W.-B., I.A., J.S., T.L.-G., and L.A. performed research; T.W.-B., I.L.-L., T.L.-G., and L.A. analyzed data; T.W.-B., T.L.-G., and L.A. wrote the paper.
Abstract
Thyroid hormones (THs), thyroxine (T4), and triiodothyronine (T3), regulate growth, metabolism, and neurodevelopment. THs secretion is controlled by the pituitary thyroid-stimulating hormone (TSH) and the hypothalamic–pituitary–thyroid (HPT) axis. The organic anion-transporting polypeptide 1C1 (OATP1C1/SLCO1C1) and the monocarboxylate transporter 8 (MCT8/SLC16A2) actively transport THs, which bind to their nuclear receptors and induce gene expression. A mutation in OATP1C1 is associated with brain hypometabolism, gradual neurodegeneration, and impaired cognitive and motor functioning in adolescent patients. To understand the role of Oatp1c1 and the mechanisms of the disease, we profiled the transcriptome of oatp1c1 mutant (oatp1c1−/−) and mct8−/−xoatp1c1−/− adult male and female zebrafish brains. Among dozens of differentially expressed genes, agouti-related neuropeptide 1 (agrp1) expression increased in oatp1c1−/− adult brains. Imaging in the hypothalamus revealed enhanced proliferation of Agrp1 neurons in oatp1c1−/− larvae and adults, and increased food consumption in oatp1c1−/− larvae. Similarly, feeding and the number of Agrp1 neurons increased in thyroid gland-ablated zebrafish. Pharmacological treatments showed that the T3 analog TRIAC (3,3′,5-tri-iodothyroacetic acid), but not T4, normalized the number of Agrp1 neurons in oatp1c1−/− zebrafish. Since the HPT axis is hyperactive in the oatp1c1−/− brain, we used the CRISPR-Cas9 system to knockdown tsh in oatp1c1−/− larvae, and inducibly enhanced the HPT axis in wild-type larvae. These manipulations showed that Tsh promotes proliferation of Agrp1 neurons and increases food consumption in zebrafish. The results revealed upregulation of both the HPT axis–Agrp1 circuitry and feeding in a zebrafish model for OATP1C1 deficiency.
SIGNIFICANCE STATEMENT Mutation in the thyroid hormone (TH) transporter OATP1C1 is associated with cognitive and motor functioning disturbances in humans. Here, we used an oatp1c1−/− zebrafish to understand the role of organic anion-transporting polypeptide 1C1 (Oatp1c1), and the characteristics of OATP1C1 deficiency. Transcriptome profiling identified upregulation of agrp1 expression in the oatp1c1−/− brain. The oatp1c1−/− larvae showed increased thyroid-stimulating hormone (tsh) levels, proliferation of Agrp1 neurons and food consumption. Genetic manipulations of the hypothalamic–pituitary–thyroid (HPT) axis showed that Tsh increases the number of Agrp1 neurons and food consumption. The T3 analog TRIAC (3,3′,5-tri-iodothyroacetic acid) normalizes the number of Agrp1 neurons and may have potential for the treatment of Oatp1c1 deficiency. The findings demonstrate a functional interaction between the thyroid and feeding systems in the brain of zebrafish and suggest a neuroendocrinological mechanism for OATP1C1 deficiency.
Introduction
The thyroid hormones (THs), thyroxine (T4), and triiodothyronine (T3) are essential regulators of development, neurogenesis, growth, and metabolism in all vertebrates (Yen, 2001). In mammals, TH secretion is regulated by the hypothalamic–pituitary–thyroid (HPT) axis and a negative TH feedback loop. Hypothalamic thyrotropin-releasing hormone (TRH) stimulates the synthesis of pituitary thyroid-stimulating hormone (TSH), which induces TH biosynthesis in the thyroid gland (Fekete and Lechan, 2014). These endocrinological pathways are similar in fish, although the TH-negative feedback loop affects Tsh and not Trh synthesis and secretion in a few fish species (Geven et al., 2006; Iziga et al., 2010; Ogawa et al., 2013). T4 is taken up from the blood and is converted to the active hormone T3 by the iodothyronine deiodinase type 2. This occurs primarily in astrocytes (Guadaño-Ferraz et al., 1997). In the target cells, T3 binds to its nuclear thyroid receptors TRs, which activates the expression of hundreds of genes (Brent, 2012). This process requires TH to be transported across the cell membrane. Two key TH transporters are the organic anion-transporting polypeptide 1C1 (OATP1C1 [protein coding gene name: solute carrier organic anion transporter family member 1c1 (SLCO1C1); also known as OATP14 or OATP-F]; Tohyama et al., 2004; Heuer and Visser, 2009) and the monocarboxylate transporter 8 [MCT8; protein coding gene name: solute carrier organic anion transporter family member 16a2 (SLC16A2); Friesema et al., 2003].
Mutation in OATP1C1 has been recently diagnosed in an adolescent patient who gradually lost cognitive and motor functioning. Magnetic resonance imaging and positron emission tomography-computed tomography showed a severe decrease in glucose metabolism in the entire brain and degeneration of axonal fibers in the cerebrum. Functional in vitro studies showed reduced T4 transport in mutated OATP1C1 cells. Although the serum TH levels were normal, brain hypothyroidism was considered because of the loss of T4 transport in cell lines, the location of the mutation in the TH transporter, and TH-related symptoms such as developmental delay and abnormal energy metabolism in the brain (Strømme et al., 2018).
To study the role of OATP1C1 and the mechanism of the disease, animal models were developed. The Oatp1c1-KO mice do not exhibit a neurologic phenotype, likely because of functional overlap between OATP1C1 and MCT8 (Mayerl et al., 2014). The transparent zebrafish is a simple vertebrate with a brain, HPT axis, and TH transporters conserved structurally and functionally as in mammals (Zada et al., 2017; Vancamp and Darras, 2018). In addition, thyroid gland-deficient and TH transporter mutant zebrafish are effective tools to study the roles of THs and TH transporter disorders (McMenamin et al., 2014; Zada et al., 2014, 2016; Blitz et al., 2021). In zebrafish, oatp1c1 is mainly expressed in endothelial cells, neurons, and astrocytes. We developed an oatp1c1 mutant (oatp1c1−/−) zebrafish that exhibits hyperactivity of the HPT axis, hyperlocomotor activity, altered development of glial cells, and shorter neuronal axons, as well as enlargement of the thyroid gland (goiter). The goiter is enhanced in mct8−/−xoatp1c1−/− compared with oatp1c1−/− adults, suggesting that mutation in both TH transporters amplifies the effect of hypothyroidism in the brain. Notably, the TH analogs DITPA (diiodothyropropionic acid) and TRIAC (3,3',5-tri-iodothyroacetic acid) can normalize the goiter in mct8−/−xoatp1c1−/− zebrafish (Admati et al., 2020).
Here, we exploit the oatp1c1−/− zebrafish to understand the role of Oatp1c1 and the mechanism of Oatp1c1 deficiency. Whole transcriptome sequencing (seq), in situ hybridization (ISH) chain reaction, imaging of single cells, and functional genetic and pharmacological manipulations revealed regulation of hypothalamic neuronal circuits and feeding by Oatp1c1 and the HPT axis.
Materials and Methods
Zebrafish husbandry.
Adult male and female zebrafish were raised and maintained in fully automated zebrafish housing systems (Aquazone; temperature, 28 ± 0.5°C; pH 7.0; conductivity, 500 μS) under 14 h/10 h light/dark cycles, and fed twice a day. Embryos were produced by natural spawning and raised in egg water containing methylene blue (0.3 ppm) in a light-controlled incubator at 28 ± 0.5°C, as previously described (Elbaz et al., 2012). All animal protocols were reviewed and approved by the Bar-Ilan University Bioethics Committee.
RNA extraction and whole-transcriptome RNA-seq.
Brains of an equal number of male and female wild-type (WT), oatp1c1−/−, and mct8−/−xoatp1c1−/− zebrafish (n = 3/sample) were used for total RNA extraction, using the RNeasy Mini Kit (Qiagen) according to the manufacturer protocol. The quality and quantity of each RNA sample were assessed by a bioanalyzer (2100 Bioanalyzer 6000 Pico Kit, Agilent Technologies). RNA libraries were prepared using TrueSeq RNA Library Prep Kit version 2 (Illumina) according to the manufacturer protocol. Six libraries were loaded on one lane of an HiSeq2500 instrument (Illumina), a 100 bp paired-end run at the Technion Genome Center. A paired-end RNA-seq protocol was used, yielding ∼37–43 million paired reads per sample. Paired-end reads were aligned to the zebrafish genome (GRCz10/danRer10) using the STAR RNA-seq aligner software (version STAR_2.5.0a; Dobin et al., 2013). The STAR genome database was built with the Ensembl annotation file (Danio_rerio.GRCz10.82.gtf). Only uniquely mapped reads (34–40 million paired reads/sample) were considered for further analysis. Raw read counts for 31,954 Ensembl-annotated gene-level features were determined using HTSeq-count (Anders et al., 2015). Differentially expressed genes were determined with the R Bioconductor package DESeq2 (Love et al., 2014). The p-values were corrected with the Benjamini–Hochberg false discovery rate (FDR) procedure. Genes with adjusted p-values <0.05 and |log2foldchange > 1| were considered to be differentially expressed. The generated list of DESeq2 genes was uploaded to the Database for Annotation, Visualization, and Integrated Discovery bioinformatics resource (Huang et al., 2009) for gene ontology and the Kyoto Encyclopedia of Genes and Genomes for pathway analyses.
Quantitative real-time PCR.
The relative mRNA levels of crha (Ensembl number: ENSDARG00000093401), agrp1 (ENSDARG00000069089), pvalb1 (ENSDARG00000037789), neflb (ENSDARG00000012426.13), p2rx2 (ENSDARG00000002300), slc18b1 (ENSDARG00000044047), msh4 (ENSDARG00000075826), trh [National Center for Biotechnology Information (NCBI) accession number: NM_001012365.2), tsh (NM_181494.2), tg (NM_001329865.1), and actin (NCBI accession number: AY222742.1) were determined using real-time PCR (RT-PCR). Total mRNA was extracted from three groups of oatp1c1+/+ and three groups of oatp1c1−/− adult brains (three brains per sample), using the RNeasy Protect Mini Kit (Qiagen) according to the manufacturer instructions. A 1 μg sample of mRNA was reverse transcribed using qScript cDNA SuperMix (Quanta BioSciences). Relative transcript levels were determined by the 7900HT Fast Real-Time PCR System (Thermo Fisher Scientific). Triplicates of each cDNA sample were PCR amplified using the PerfeCTa SYBR Green FastMix (Quanta BioSciences) and the following specific primers: crha: 5′-TGATCTGACGTTTCACCTGC-3′ and 5′-TCTTGCGGTTGTGGGTTAC-3′; agrp1: 5′-ACACAGTAATCTTCGGCTGG-3′ and 5′-TCAAGGTGCTCCATTTCAGG-3′; pvalb1: 5′-GAGTTCTGACCGATAAAGAGACC-3′ and 5′-GAGTGCTGGTTCCTTGATATTTG-3′; neflb: 5′-CTAGAGATTGAGGCATGTCAGG-3′ and 5′-GCCATTTCACTCTTCATTGTCC-3′; p2rx2: 5′-GGAAGTGCGATTTTGACGTG-3′ and 5′-GCTTCTGTACTCCACACCATC-3′; slc18b1: 5′-GGTGGGCTCTTTGATACTTGG-3′ and 5′-AGCAATGAATACTGTCCCGTC-3′; msh4: 5′-ACATGAAATACCCTGAGCTGG-3′ and 5′-CTGTAGAGTTTGGTTCCCTGTC-3′; tg: 5′-AGCAGAGCCAAGAACACTAAG-3′ and 5′-GTAAAGAGTAGAACCAGGTCG-3′; tsh: 5′-CCCACTGACTACACCATCTAC-3′ and 5′-CATCCCCTCTGAACAATAAAACG-3′; and trh: 5′-GCAGACCCACAGCATCAG-3′ and 5′-CAGGCCAAGACGAACACA-3′. The relative quantification of gene expression levels was normalized against β-actin in all assays (Tang et al., 2007), with the β-actin primers 5′-CAACAGGGAAAAGATGACACAG-3′ and 5′-CATCACCAGAGTCCATCACG-3′, and ΔΔCT analysis (Schmittgen and Livak, 2008). The β-actin gene was selected since its relative expression did not significantly change between oatp1c1−/− and WT during the various developmental stages. Gene levels were normalized by dividing the absolute levels of each sample by the average of all WT samples.
CRISPR-Cas9-based knock-down assays.
To knock down (KD) tsh, we used the modified CRISPR-Cas9 protocol as previously described (Zada et al., 2021) Three tsh-specific single guide RNAs (sgRNAs) were designed and synthesized (Alt-R CRISPR-Cas9 System, IDT). The sgRNAs were diluted in IDTE buffer to give a 100 μm stock solution, according to the manufacturer protocol. Preassembled ribonucleoproteins (RNPs) composed of Cas9 protein and sgRNA are highly effective in zebrafish. RNPs were generated before the microinjection by mixing 2 μg/μl Alt-R S.p. Cas9 Nuclease V3 (IDT) and 300 ng/μl each sgRNA. The samples were then incubated at 37°C for 5 min, chilled in ice-cold water, and microinjected into one-cell stage embryos.
Transient expression assays.
To overexpress trh, we generated a pT2-hsp70:trh plasmid that can inducibly overexpress trh under the control of a heat-shock promoter. We amplified the coding sequence of trh (NCBI accession number: NM_001012365.2) using the following primers: 5′-ATCGATGGATCCAATGCGGGCGGTGTGTGTGTT-3′ and 5′-ATCGATATCGATTTACTCTAGCCCCGGCAGCT-3′. Ligation of BamHI/ClaI-digested pT2-hsp70:gal4 vector (provided by Karina Yaniv, Weizmann Institute of Science, Rehovot, Israel) and BamHI/ClaI-digested trh coding sequence was performed.
Transient expression assays of DNA constructs were performed by microinjection of ∼2 nl into one-cell-stage zebrafish zygotes at a concentration of 50 ng/µl, using a micromanipulator and a PV830 Pneumatic Pico Pump (World Precision Instruments). In inducible overexpression experiments, the progeny of pT2-hsp70:trh and pT2-hsp70:gal4 were raised under 14 h/10 h light/dark cycle at 28°C. At 3, 4, and 5 d postfertilization (dpf), heat shock was performed by placing the larvae in a 37°C incubator for 1 h. Then, at 6 dpf, larvae were fixed, and mRNA expression was detected by whole-mount ISH and hybridization chain reaction (HCR).
Whole-mount ISH, HCR, and probe preparation.
To prepare mRNA antisense probes, the full coding sequences of crha, agrp1, and trh were amplified. The PCR products were cloned into a pCRII-TOPO vector (Thermo Fisher Scientific) or pGEM vector (Promega), which served as a template to transcribe digoxigenin-labeled and/or fluorescein-labeled antisense mRNA probes. Larvae and adult brains were fixed in 4% paraformaldehyde overnight at 4°C and stored in 100% methanol. The location and level of mRNA expression were detected by whole-mount ISH, as described previously (Elbaz et al., 2012).
HCR enables multiplexed, quantitative, high-resolution RNA fluorescence ISH with automatic background suppression and multiple color-coded RNA probes. We designed probes to agrp1 according to the split initiator approach of third-generation in situ HCR version 3.0 (Choi et al., 2018). Even and odd 25 nt DNA antisense oligonucleotide pairs carrying split B1 initiation sequences were tiled across the length of the mRNA transcript and hybridized with dye-conjugated hairpins (catalog #B1-647, Molecular Technologies). HCR was performed as previously described (Lovett-Barron et al., 2020). Zebrafish were fixed overnight in 4% paraformaldehyde in 1× PBST at 4°C. After washing (3 times in 1× PBST, 5 min each), larvae and adult brains were permeabilized for 10 min in 100% (v/v) methanol at −20°C and then rehydrated [50% (v/v) methanol, 25% (v/v) methanol, then in 2× saline-sodium citrate buffer (SSCT); 5 min each]. Hybridization with the probe was performed overnight in 2× SSCT, 10% (v/v) dextran sulfate, and 10% (v/v) formamide at the probe concentration of 4 nm. The next day, larvae or adult brains were washed [3 times in 2× SSCT, 30% (v/v) formamide at 37°C, then two times in 2× SSCT at room temperature, 20 min each] and incubated in amplification buffer [5× SSCT, 10% (v/v) dextran sulfate]. Dye-conjugated hairpins were heated to 95°C for 1 min, then snap cooled on ice. Hairpin amplification was performed by incubating individual larvae and brains in 80 and 150 μl amplification buffer, with the probe at concentrations of 180 and 120 nm, respectively, overnight under darkness. Samples were washed three times with 5× SSCT for 20 min each, then mounted for imaging.
Imaging and image analysis.
An epifluorescent stereomicroscope (model M165FC, Leica) and a confocal microscope (model LSM710, Zeiss) were used to visualize fluorescent reporters and to image whole-mount ISH-stained and HCR-stained larvae and brain sections. Images of larvae and brain sections were taken using Leica Application Suite imaging software (version 4.12; Leica). Hypothalamic images for cell quantifications were taken using an upright confocal microscope (model LSM710, Zeiss).
The number of Agrp1 and Crha neurons was quantified using ImageJ software (National Institutes of Health). To quantify the number of Agrp1 and Crha neurons, a 170 × 170 µm area was imaged in the hypothalamus of 2, 3, and 6 dpf larvae, and a 425 × 425 µm area was imaged in the hypothalamus of adult brains. The number of positive cells was calculated manually using a cell counter plugin on each optical slice.
Feeding assay.
Food consumption was measured according to a previously described protocol (Shimada et al., 2012; Shainer et al., 2019), with several modifications. Briefly, 4 dpf larvae from each group were placed in one litter tank and fed with paramecia twice a day. At 7 dpf, five larvae of each group were transferred into a six-well plate and fed with unstained paramecia. Following 2 h of feeding, the wells were washed twice with 6 ml of embryo water (5 mm NaCl, 0.17 mm KCl, 0.33 mm CaCl2, and 0.33 mm MgSO4). To quantify the amount of food consumed, the paramecium was fluorescently labeled with 25 ml of 4-Di-10-ASP (Thermo Fisher Scientific) for 20 min, after which it was harvested using a 20 µm mesh to remove the remaining dye. The concentration of the paramecia in the water was evaluated under a microscope, and each well received ∼500 fluorescently labeled paramecia. At 8 dpf, the larvae were fed with the labeled paramecia for 30 min, and then the wells were washed twice with embryo water to remove the residual paramecia. The larvae were then anesthetized and homogenized. The homogenates were transferred into a 96-well plate for fluorescent measurement, using a plate reader (Synergy HTX, BioTek) with an excitation wavelength of 488 nm and an emission wavelength of 528 nm.
Pharmacological assays.
In all pharmacological assays, larvae were placed in glass plates (15 larvae/plate) containing a specific drug or 5 × 10⁻⁶ m NaOH diluted in zebrafish water. The exposure medium (25 ml/plate and 500 ml/beaker) was replaced once a day. A stock solution of 100 μm T4, 100 μm T3, and TRIAC/TA3 (Sigma-Aldrich) was prepared in 0.05–0.1 m NaOH and diluted in zebrafish water to the final administered concentrations. To choose the appropriate working dilution for each substance, a preliminary dose-dependent assay was performed, and the highest dose that did not affect behavior and the general morphology of the larvae was selected, as previously described (Zada et al., 2014; Admati et al., 2020).
Inducible thyroid gland ablation.
To ablate thyroid gland cells, we followed a previously published protocol (McMenamin et al., 2014). Three d postfertilization Tg(tg:nVenus-2a-nfsB) larvae and adults were treated with freshly prepared 10 mm metronidazole (MTZ; catalog #M1547, Sigma-Aldrich) dissolved in 0.1% dimethylsulfoxide (DMSO) at 28°C for 48 h under constant darkness. The MTZ-containing embryo medium was refreshed once a day. The control Tg(tg:nVenus-2a-nfsB) larvae and adults were incubated in 0.1% DMSO. The loss of nVenus expression in larvae and adults was confirmed using an epifluorescent stereomicroscope. The thyroid gland-ablated larvae were sampled at 6 dpf, and the adult brains were sampled 2 weeks post-treatment.
Experimental design and statistical analysis.
To analyze the differences in the cell number and gene expression levels between the two groups, a two-tailed Student's t test was performed using the ToolPac in Excel. To compare gene expression levels among oatp1c1−/−, WT, T4-treated oatp1c1−/−, and TRIAC-treated oatp1c1−/− zebrafish, ANOVA was performed using the ToolPac in Excel. Data for all experiments are presented as the mean ± SEM.
Results
Profiling the transcriptome of oatp1c1−/− and mct8−/−xoatp1c1−/− adult brains
To understand how the loss of the thyroid transporters affects gene expression, we performed whole-transcriptome RNA-seq in oatp1c1−/−, mct8−/−xoatp1c1−/−, and their WT sibling adult brains. The bioinformatic analysis identified 968 differentially expressed genes both in oatp1c1−/− and mct8−/−xoatp1c1−/− adult brains; some of them overlap (FDR < 0.05, 1 < log2-fold change < −1; Fig. 1A–C). Seventy-eight genes were identified only in oatp1c1−/− brains: 16 were upregulated, and 62 were downregulated. Eight hundred two genes were identified only in mct8−/−xoatp1c1−/− brains: 294 were upregulated, and 508 were downregulated. Among the 88 genes that deferentially expressed overlap in both oatp1c1−/− and mct8−/−xoatp1c1−/− brains, 33 and 55 genes were upregulated and downregulated, respectively (Fig. 1D,E). Among these genes, several showed a robust increase (Fig. 1F) and decrease (Fig. 1G) in expression in both oatp1c1−/− and mct8−/−xoatp1c1−/− adult brains. To validate the RNA-seq results, we performed quantitative RT-PCR (qRT-PCR) using cDNA extracted from additional batches of oatp1c1−/− and WT sibling adult brains. We tested the expression of candidate-selected genes, including corticotropin-releasing hormone a (crha), agouti-related neuropeptide 1 (agrp1), parvalbumin 1 (pvalb1), neurofilament light pollypeptide b (neflb), purinergic receptor P2X ligand-gated ion channel 2 (p2rx2), solute carrier family 18 subfamily B member 1 (slc18b1), and mutS homolog 4 (msh4). Notably, the bioinformatic analysis showed protein-protein interaction between AGRP and TRH (Fig. 1H). Consistent with the RNA-seq data, the expression of crha mRNA increased by 12-fold (p < 0.05) and the expression of agrp1 mRNA increased by eightfold (p < 0.05; Fig. 1I). These findings show that the loss of Oatp1c1 results in altered expression of key hypothalamic genes that regulate metabolism.
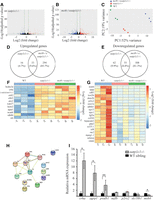
Transcriptome profiling of oatp1c1−/− and mct8−/−xoatp1c1−/− adult brains. A, B, Volcano plots of differentially expressed genes (DEGs) in oatp1c1−/− (A) and mct8−/−xoatp1c1−/− brains (B; n = 3 brains for each group). The red and blue dots represent significant upregulated and downregulated genes (FDR < 0.05, |log2(fold change)| > 1), respectively. The green vertical lines mark the boundaries defined for differentially expressed genes. C, Principal component analyses (PCAs) of the RNA-seq data. Gene expression changes were compared among WT, oatp1c1−/−, and mct8−/−xoatp1c1−/− zebrafish. D, E, The numbers of genes that upregulated (D) or downregulated [E; FDR < 0.05, log2 (fold change) < −1 or log2 (fold change) > 1]. F, G, Heat map of selected annotated upregulated (F) and downregulated (G) transcripts. H, Protein–protein interactions proposed by the STRING analysis of the RNA-seq data. I, RT-PCR analysis shows the relative mRNA expression levels of selected genes (n = 3 batches for each genotype). Values are represented as the mean ± SEM. Statistical significance determined by t test: two-sample assuming unequal variances. *p < 0.05, **p < 0.01.
Enhanced proliferation of hypothalamic Agrp1 neurons in the developing oatp1c1−/− zebrafish
The transcriptome analysis showed upregulation of the feeding and metabolism regulator agrp1 gene (Fig. 1F,I), suggesting cell-specific increased transcription or enhanced Agrp1 neuronal proliferation in the absence of the TH transporter Oatp1c1. AGRP neurons are located in the arcuate nucleus of the mammalian hypothalamus, and induce linear growth and food consumption (Dietrich et al., 2015). Two paralogs of the agouti family have been identified in the zebrafish brain: agrp1 and agrp2 (also named asip2). Agrp1-expressing neurons are located in the ventral hypothalamus and, similar to mammals, regulate food consumption in zebrafish (Shainer et al., 2019). To characterize the spatial expression pattern of agrp1 during development, we performed whole-mount ISH experiments in 2, 3, and 6 dpf oatp1c1−/− embryos and larvae. At 2 dpf, agrp1 neurons were apparent only in oatp1c1−/− embryos (Fig. 2 A,B,I). At 3 and 6 dpf, the number of Agrp1 neurons increased by ∼1.4-fold and 1.6-fold, respectively, in oatp1c1−/− larvae compared with their WT siblings (Fig. 2C–I). To understand whether this developmental effect is regulated specifically by the TH transporter Oatp1c1 and whether it is specific to Agrp1 neurons, we quantified the number of Agrp1 neurons in mct8−/− larvae and the number of crha-expressing neurons in oatp1c1−/− larvae. At 6 dpf, the number of Agrp1 neurons was similar in both mct8−/− and WT sibling larvae (Fig. 2J–N). Similarly, the number of crha-expressing neurons, located in the lateral tuberal nucleus of the ventral hypothalamus (Grone and Maruska, 2015), did not change in 6 dpf oatp1c1−/− larvae (Fig. 2O–S). These results show that the loss of Oatp1c1 mediates the specific upregulation of hypothalamic Agrp1 neuron proliferation during development.

The number of Agrp1 neurons increases in oatp1c1−/− larvae and adults. A–H, J–M, O–R, Dorsal view of the larva head. Head points to the top. A–H, Whole-mount ISH staining shows the spatial distribution of Agrp1 neurons at 2 dpf (A, B), 3 dpf (C, D), and 6 dpf (E–H). The dotted frame shows the location of the Agrp1 neurons. G, H, High-magnification images of the cells shown in E and F. I, The number of Agrp1 neurons (2, 3 dpf, n = 10 embryos for each genotype; 6 dpf oatp1c1−/−, n = 20 larvae; 6 dpf WT, n = 15 larvae). J, K, Whole-mount ISH staining shows the spatial distribution of Agrp1 neurons. L, M, High-magnification images of the cells shown in J and K. N, The number of Agrp1 neurons (n = 10 larvae for each genotype). O, P, Whole-mount ISH staining shows the spatial distribution of Crha-expressing neurons. Q, R, High-magnification images of the cells shown in O and P. S, The number of Crha neurons (n = 10 larvae for each genotype). T, Schematic illustration of the location of Agrp1 neurons (marked with green circles) in the adult brain. Vertical dashed lines represent the location of the brain sections. U, A representative brain section shows the location of Agrp1 neurons in the ventral zone of the periventricular hypothalamus (Hv). The dotted frame shows a high-magnification view of the Hv and the Agrp1 neurons. V, W, Whole-mount HCR staining of Agrp1 neurons in representative adult sections. X, The number of Agrp1 neurons in adult brains (n = 3 larvae for each genotype). Scale bars: (in A) A–F, J, K, O, P, 50 μm; (in G) G, H, L, M, Q, R, 15 μm; U, 200 μm; (in V) V, W, 20 μm. Values are represented as the mean ± SEM. Statistical significance determined by t test: two-sample assuming unequal variances. *p < 0.05, ***p < 0.0001.
To understand whether this effect is consistent in the adult stage, we performed whole-mount HCR experiments on oatp1c1−/− and WT sibling adult brains. In the periventricular hypothalamus (Fig. 2T,U), the expression of agrp1 was apparent in wider hypothalamic areas in oatp1c1−/− brains compared with WT sibling brains (Fig. 2V,W). Similar to the findings in larvae, the number of Agrp1 neurons increased by 2.1-fold in oatp1c1−/− compared with WT sibling adults (Fig. 2X). Altogether, these results show that the number of Agrp1 neurons increases in oatp1c1−/− zebrafish embryos, larvae, and adults.
The number of Agrp1 neurons increases in thyroid gland-ablated larvae and adults
The loss of Oatp1c1 can partially block TH signaling in the brain and enhances the activity of the HPT axis (Admati et al., 2020). To understand the role of THs in regulating Agrp1 neurons, we used the MTZ-dependent inducible genetic system (McMenamin et al., 2014) and ablated the thyroid gland of Tg(tg:nVenus-2a-nfsB) larvae and adults (Fig. 3A). To validate the specificity and efficiency of the thyroid gland ablation, qRT-PCR was performed in 6 dpf larvae. As expected, there was a decrease and an increase in the expression of thyroglobulin (tg) and tsh, respectively, but there was no change in the expression of trh (Fig. 3B). These findings were confirmed in T3-treated larvae, which exhibited a decrease in tsh expression, but no change in trh expression (Fig. 3C). These results indicate that the TH-negative feedback primarily affects the pituitary tsh in zebrafish, which is consistent with previous studies in various fish species (Geven et al., 2006; Iziga et al., 2010; Ogawa et al., 2013). To test whether Agrp1 neurons are affected by hypothyroidism, we quantified their number in thyroid gland-ablated larvae and adults. At 6 dpf, wider distribution and an increased number (∼1.8-fold) of the Agrp1 neurons were observed in MTZ-treated thyroid gland-ablated larvae compared with DMSO-treated control larvae (Fig. 3D–G,J). Similarly, the number of Agrp1 neurons increased by 1.4-fold in the brains of thyroid gland-ablated compared with control adults (Fig. 3H,I,K). These results show that lack of THs results in an increased number of Agrp1 neurons in larvae and adults, as is the case in oatp1c1−/− zebrafish.

The number of Agrp1 neurons increases in thyroid gland-ablated larvae and adults. A, Schematic illustration of thyroid gland ablation in Tg(tg:nVenus-2a-nfsB) larvae and adults. B, C, Relative mRNA expression levels in 6 dpf larvae (n = 4 batches for each genotype). D, E, Dorsal view of the larva head. Head points to the top. Whole-mount ISH staining shows the spatial distribution of Agrp1 neurons in 6 dpf larvae. F, G; High-magnification images of neurons shown in D and E. H, I, Whole-mount HCR staining of Agrp1 neurons in representative adult sections. J, The number of Agrp1-positive neurons (thyroid gland-ablated, n = 11 larvae; control, n = 7 larvae). K, The number of Agrp1 neurons in adult brains (n = 3 brains for each genotype). Scale bars: (in D) D, E, 50 μm; (in F) F, G, 15 μm; (in H) H, I, 20 μm. Values are represented as the mean ± SEM. Statistical significance determined by t test: two-sample assuming unequal variances. *p < 0.05, **p < 0.01, ***p < 0.0001.
Food consumption increases in oatp1c1−/−, thyroid gland-ablated, and trh-overexpressing larvae
Reduced levels of THs increase the number of Agrp1 neurons. To explore how manipulation of the TH system affects feeding, we monitored food consumption by feeding larvae fluorescently labeled paramecia and quantifying the fluorescence levels (Fig. 4A,B). At 8 dpf, the oatp1c1−/− larvae had increased levels of consumption compared with their WT siblings. Similarly, there was increased food consumption in thyroid gland-ablated larvae. Since the HPT axis is hyperactive in both oatp1c1−/− and thyroid gland-ablated larvae, we activated the HPT axis using genetic overexpression of the hypothalamic trh, which also resulted in elevated food consumption. In contrast, there was no difference in food consumption between mct8−/− larvae and their WT siblings (Fig. 4C). These results demonstrate that loss of Oatp1c1 and activation of the HPT axis increase feeding in zebrafish. Considering the increased number of Agrp1 neurons in oatp1c1−/− and thyroid gland-ablated zebrafish (Figs. 2, 3), the results suggest that AgRP1 neurons mediate the increased food consumption.

Food consumption increases in oatp1c1−/−, thyroid gland ablation and overexpression of Trh larvae. A, Timelines of the feeding assay. B, Lateral view of 8 dpf larvae fed with stained and unstained paramecium. Scale bar, 1 mm. C, Quantification of food consumption (n = 5–7 batches for each group). Values are represented as the mean ± SEM. Statistical significance determined by t test: two-sample assuming unequal variances. *p < 0.05.
The TH analog TRIAC can normalize the number of Agrp1 neurons in oatp1c1−/− larvae
The marked changes in the Agrp1 neuronal number provide an ideal neurologic readout to test pharmacological treatments for Oatp1c1 deficiency. We conducted a comparative pharmacological assay and evaluated the restorative potential of the TH analog TRIAC. Studies in cell lines, Mct8-KO mice, and mct8−/− larval zebrafish have demonstrated that TRIAC can enter the cells and rescue neurologic phenotypes independently of the presence of the TH transporter Mct8 (Verge et al., 2012; Kersseboom et al., 2014; Zada et al., 2014, 2016; Groeneweg et al., 2017). We have recently shown that TRIAC can normalize the function of the HPT axis in oatp1c1−/− zebrafish (Admati et al., 2020). To monitor the putative therapeutic effect of TRIAC on Oatp1c1 deficiency, we treated oatp1c1−/− larvae with 5 nM TRIAC, 5 nM T4, or 5 nM NaOH and quantified the number of Agrp1 neurons using whole-mount HCR. The drugs were administered into the water between 24 h postfertilization and 3 dpf (Fig. 5A) or 3–6 dpf (Fig. 5C), and the larvae were fixed immediately following each treatment. At 3 dpf, both TRIAC and T4 normalized the number of Agrp1 neurons in oatp1c1−/− larvae (Fig. 5B). In contrast, TRIAC, but not T4, normalized the number of Agrp1 neurons in 6 dpf oatp1c1−/− larvae (Fig. 5D–H). These results show that TRIAC can prevent (Fig. 5B) and even rescue (Fig. 5D) hypothalamic deficiency.
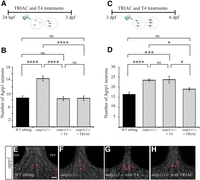
TRIAC normalizes the numbers of the Agrp1 neurons in oatp1c1−/− larvae. A, C, Timelines of the drug treatments. B, D, The number of Agrp1 neurons in 3 dpf (B) and 6 dpf (D) larvae (n = 10–12 larvae for each genotype). E–H, Dorsal view of the head, which points to the top. Whole-mount HCR staining of Agrp1 neurons (red) in 6 dpf larvae. Scale bar: (in E) E–H, 50 μm. Values are represented as the mean ± SEM. Statistical significance determined by ANOVA: single factor. nsp > 0.05, *p < 0.05, ***p < 0.001, ****p < 0.0001.
Tsh induces Agrp1 neuron proliferation
The HPT axis is regulated by a negative feedback loop, and THs can inhibit the secretion of TRH and TSH and their own biosynthesis in mammals (Fekete and Lechan, 2014). We have previously reported hyperactivity of the HPT axis in oatp1c1−/− larvae (Admati et al., 2020). To investigate whether the HPT axis regulates Agrp1 neurons, and to mimic the HPT axis upregulation found in oatp1c1−/− larvae, we used a heat shock-mediated inducible system to overexpress trh in WT larvae (Fig. 6A). Whole-mount ISH assays confirmed the overexpression of trh in the brains of pT2-hsp70:trh-injected compared with pT2-hsp70:gal4-injected 6 dpf larvae (Fig. 6B,C), and HCR assays revealed that the number of Agrp1 neurons increased by ∼1.5-fold in the pT2-hsp70:trh-injected larvae (Fig. 6D–F). In zebrafish, THs inhibit the expression of tsh but not trh (Fig. 3B,C). To test whether Tsh regulate Agrp1 neurons, we knocked down Tsh (Tsh-KD) using the highly effective CRISPR-Cas9 system (Fig. 6G). The knock-down strategy was selected because an inherited Tsh mutation is expected to abolish the function of the THs and can have an effect on embryo development. The efficiency of the KD was confirmed by qRT-PCR using mRNA extracted from oatp1c1−/− and Tsh-KD oatp1c1−/− larvae. As expected, the expression of tg mRNA was reduced by approximately threefold in Tsh-KD oatp1c1−/− larvae (Fig. 6H). Whole-mount HCR assays in WT, oatp1c1−/−, and Tsh-KD oatp1c1−/− 6 dpf larvae revealed the expected increase in the number of Agrp1 neurons in the oatp1c1−/− larvae compared with WT. Notably, Tsh-KD reduced the number of Agrp1 neurons in Tsh-KD oatp1c1−/− and normalized the levels to those in oatp1c1−/− larvae (Fig. 6I). These results show that Tsh increases the number of Agrp1 neurons. Altogether, the results suggest that insufficient Oatp1c1-mediated T4 transport upregulates Tsh secretion, which induces the proliferation of Agrp1 neurons and increases food consumption in the zebrafish model for Oatp1c1 deficiency (Fig. 6J).
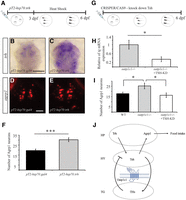
Genetic manipulations of the HPT axis show that Tsh increases the number of Agrp1 neurons. A, Timeline of the injection of pT2-hsp70:trh and the heat shock. B, C, Dorsal view of the head, which points to the top. Whole-mount ISH staining shows the spatial expression pattern of trh mRNA (purple) in 6 dpf larvae. D, E, Whole-mount HCR staining of Agrp1 neurons (red) in 6 dpf larvae. F, The number of Agrp1 neurons in 6 dpf larvae (pT2-hsp70:gal4, n = 11 larvae; pT2-hsp70:trh, n = 17 larvae). G, Timeline of the Tsh-KD experiment. H, RT-PCR analysis shows the relative tg mRNA expression levels (n = 4 batches for each genotype). I, The number of Agrp1 neurons in 6 dpf larvae (WT, n = 9 larvae; oatp1c1−/−, n = 9 larvae; Tsh-KD oatp1c1−/−, n = 10 larvae). J, Proposed mechanism that links the HPT axis and feeding regulation in zebrafish. HY, Hypothalamus; HP, hypophysis; TG, thyroid gland. Scale bars: (in B) B, C, 2 cm; (in D) D, E, 50 μm. Values are represented as the mean ± SEM. Statistical significance was determined by two-sample t test assuming unequal variances. nsp > 0.05, *p < 0.05, ***p < 0.001.
Discussion
Mutations in TH transporters and brain hypothyroidism during embryonic development cause cognitive and locomotor disabilities (Bernal et al., 2015; Groeneweg et al., 2020b). Recently, a mutation in OATP1C1 has been found in a patient who demonstrates dementia, spasticity, intolerance to cold, gray and white matter degeneration, and glucose hypometabolism (Strømme et al., 2018). To understand the role of Oatp1c1 in the brain, we used RNA-seq, single neuron labeling, pharmacology, genetic manipulations and feeding assays in a zebrafish model for Oatp1c1 deficiency. The results identified TH–Tsh–Agrp1 interaction; the loss of TH transport into the brain by Oatp1c1 resulted in hyperactivity of the HPT axis and increased Tsh signaling, which promotes Agrp1 neuronal proliferation and feeding in zebrafish (Fig. 6J). This developmental alteration can be rescued by the TH analog TRIAC.
The transcriptome profiling of oatp1c1−/− and mct8−/−xoatp1c1−/− brains revealed dozens of differentially expressed upregulated and downregulated genes that can affect the function of neuronal networks in OATP1C1 deficiency. The number of altered genes was much higher in mct8−/−xoatp1c1−/− compared with oatp1c1−/− brains, likely because Mct8-mediated transport of THs can partially compensate for the lack of Oatp1c1 in zebrafish, as is the case in mice (Mayerl et al., 2014). In the cerebral cortex and striatum of Mct8−/−/Oatp1c1−/− and Mct8−/−/iodothyronine deiodinase 2 mutant (Dio2−/−) mice, the transcriptome was also profiled (Morte et al., 2021). While most differentially expressed genes were not affected in the same way in zebrafish and mice, certain genes did display similar changes in expression. For example, trhr, wdr6, rdh10, and ano2 were upregulated in both Mct8−/−/Oatp1c1−/− and Mct8−/−/Dio2−/− mice and the expression of trh, wdr27, rdh8b, and ano2 increased in both mct8−/−xoatp1c1−/− and oatp1c1−/− zebrafish. In addition, the expression of cldn11 and rgs6 was downregulated in both Mct8−/−/Oatp1c1−/− and Mct8−/−/Dio2−/− mice, and the expression of cldn5b and rgs13 decreased in both mct8−/−xoatp1c1−/− and oatp1c1−/− zebrafish. Furthermore, Aldh1a1 and pmp22 were downregulated in Mct8−/−/Oatp1c1−/− mice, whereas aldh1l1 expression decreased in both mct8−/−xoatp1c1−/− and oatp1c1−/− zebrafish, while pmp22b expression decreased only in mct8−/−xoatp1c1−/− zebrafish. Similarly, gadd45a was downregulated in both Mct8−/−/Oatp1c1−/− and Mct8−/−/Dio2−/− mice while the expression of gadd45ab decreased in mct8−/−xoatp1c1−/− zebrafish and the expression of gadd45ba decreased in oatp1c1−/− zebrafish. The lack of a robust overlap between zebrafish and mice can be explained by species-specific effects and by sampling of the whole brain in zebrafish compared with a restriction to the cerebral cortex and striatum in mice.
The expression of agrp1 and the number of Agrp1 neurons are enhanced in the hypothalamus starting at early stages of embryonic development and lasting until adulthood in oatp1c1−/− zebrafish. Accordingly, Agrp1 neuron proliferation increased following ablation of the thyroid gland and activation of the HPT axis and decreased in Tsh-KD larvae. These results suggest that deficient transport of TH by Oatp1c1 results in the upregulation of Tsh, which in turn promotes proliferation of Agrp1 neurons. The observation of goiter in oatp1c1−/− zebrafish (Admati et al., 2020) and the finding that the number of Agrp1 neurons can be rescued by the TH analog TRIAC support this hypothesis. One possibility is that the whole brain becomes hypothyroid since Oatp1c1 expression is prominent in the vascular system and the blood–brain barrier (BBB; Admati et al., 2020). Alternatively, the hypothyroid condition may be restricted to specific tissues and cell types as a result of problems with local conversion of T4 to T3 by Dio2 in oatp1c1−/− zebrafish. At early developmental stages, Dio2 is expressed across the whole head (Dong et al., 2013), but by 2–5 dpf it is mainly expressed in the adenohypophysis (Heijlen et al., 2013). The increased tsh levels in the pituitary gland of oatp1c1−/− zebrafish suggest a lack of conversion of T4 to T3 by Dio2 and the generation of localized hypothyroidism. This may be the mechanism in additional cell types and brain regions, where oatp1c1 is localized. In the human fetal cerebral cortex, OATP1C1 and DIO2 are expressed in the outer radial glia and stem cells (Diez et al., 2021). Similarly, oatp1c1 is expressed in the radial glia cells in zebrafish (Admati et al., 2020). A malfunction of T4 transport in these cells could result in the phenotypes found in oatp1c1−/− zebrafish and the symptoms observed in OATP1C1 deficiency.
Considering the metabolic abnormalities found in Oatp1c1 deficiency, the consistent upregulation of agrp1 in the brains of both oatp1c1−/− and mct8−/−xoatp1c1−/− adults raises considerable interest. We found that food consumption and the number of Agrp1 neurons increased following activation of Tsh and in oatp1c1−/− zebrafish. Energy homeostasis acts via regulation between food consumption and energy expenditure, which is regulated by orexigenic and anorexigenic neuropeptides, such as AGRP, neuropeptide Y, proopiomelanocortin (POMC), cocaine-regulated and amphetamine-regulated transcript (CART), and α-melanocyte-stimulating hormone (αMSH). The inhibitory AGRP neurons project to multiple brain regions, including areas in the hypothalamus, thalamus, and hindbrain (Bagnol et al., 1999). They inhibit POMC neurons and antagonize the action of αMSH, thereby increasing food consumption and body weight in mammals (Cone, 2005). This role is evolutionarily conserved, and Agrp1 neurons, located in the ventral hypothalamus, also regulate food consumption in zebrafish (Song et al., 2003; Jeong et al., 2018; Shainer et al., 2019). Accordingly, the induced proliferation of Agrp1 neurons in oatp1c1−/− zebrafish can increase food intake. Intriguingly, AGRP neurons have a profound effect on glucose metabolism, as demonstrated by the selective inactivation of the insulin receptor in the mouse AGRP neurons, which results in increased glucose levels (Könner et al., 2007). Thus, an elevated number of Agrp1 neurons may explain the glucose hypometabolism observed in the OATP1C1-deficient patient (Strømme et al., 2018).
The study in oatp1c1−/− zebrafish revealed a positive interaction among Trh-, Tsh-, and Agrp1-mediated regulation of food intake. In contrast, both TRH and TSH reduce food intake in rodents (Vijayan and McCann, 1977; Amin et al., 2011), and inhibition of the HPT axis during fasting is an important adaptive mechanism to conserve energy stores in mammals (Légrádi et al., 1997; Cone, 2005; Könner et al., 2007). Furthermore, reduced TRH and TSH levels and hyperthyroidism-induced hyperphagia are associated with upregulated AgRP mRNA in rats (López et al., 2013). However, supporting the findings in zebrafish, there is a report that TRH neurons project to AGRP neurons, and that pharmacogenetic stimulation of TRH neurons activate AGRP neurons and induce feeding in mice (Krashes et al., 2014). Furthermore, Trh increases food intake in goldfish as well as the hypothalamic expression of food-promoting neuropeptides such as hypocretin/orexin and CART (Abbott and Volkoff, 2011). Similarly, fasting induces hypothalamic TRH expression in winter flounder fish (Buckley et al., 2010). Based on these heterogeneous findings, further research will be needed to understand the similarities and variations in the regulation of feeding by the HPT axis in fish and mammals.
Treatment with TRIAC either at the embryonic or larval stage, could prevent and rescue the abnormal proliferation of Agrp1 neurons, respectively. In contrast, T4 could rescue the neurologic phenotype at early embryonic stages but not in older larvae. This suggests that TRIAC, but not THs, can enter the brain and normalize the secretion of HPT hormones as well as the development of the hypothalamus in Oatp1c1 deficiency and possibly in other TH transporter disorders, including Allan–Herndon–Dudley syndrome (Fu et al., 2013; Zada et al., 2017; Groeneweg et al., 2020b). However, to date, there is insufficient evidence that treatment with TRIAC can improve the neurologic conditions of TH transporter disorders (Strømme et al., 2018; Groeneweg et al., 2019, 2020a; van Geest et al., 2021). In zebrafish, the pharmacological experiments suggest that TH transport at an early developmental stage is independent of Oatp1c1 because the expression of oatp1c1 only begins at 2 dpf. In more mature larvae, oatp1c1 is widely expressed in areas including the BBB, which is formed between 5 and 10 dpf (Admati et al., 2020). Therefore, THs may be expected to enter the brain easily during the early stages of development as seen in 3 dpf mct8−/− embryos (Zada et al., 2016). The effective rescue of TRIAC in the larvae should promote further pharmacological research on TH analogs with therapeutic potential for OATP1C1 deficiency and other disorders of TH transporters.
Footnotes
- Received December 29, 2021.
- Revision received July 25, 2022.
- Accepted August 30, 2022.
-
This work was supported by the Sherman Foundation and the University of Technology Sydney (Grant 590262), the German-Israeli Foundation for Scientific Research and Development (Grant I-1314-418.13/2015), and Fondation Jérôme Lejeune (Grant 1675).
-
The authors declare no competing financial interests.
- Correspondence should be addressed to Lior Appelbaum at lior.appelbaum{at}biu.ac.il
- Copyright © 2022 the authors




